In brief
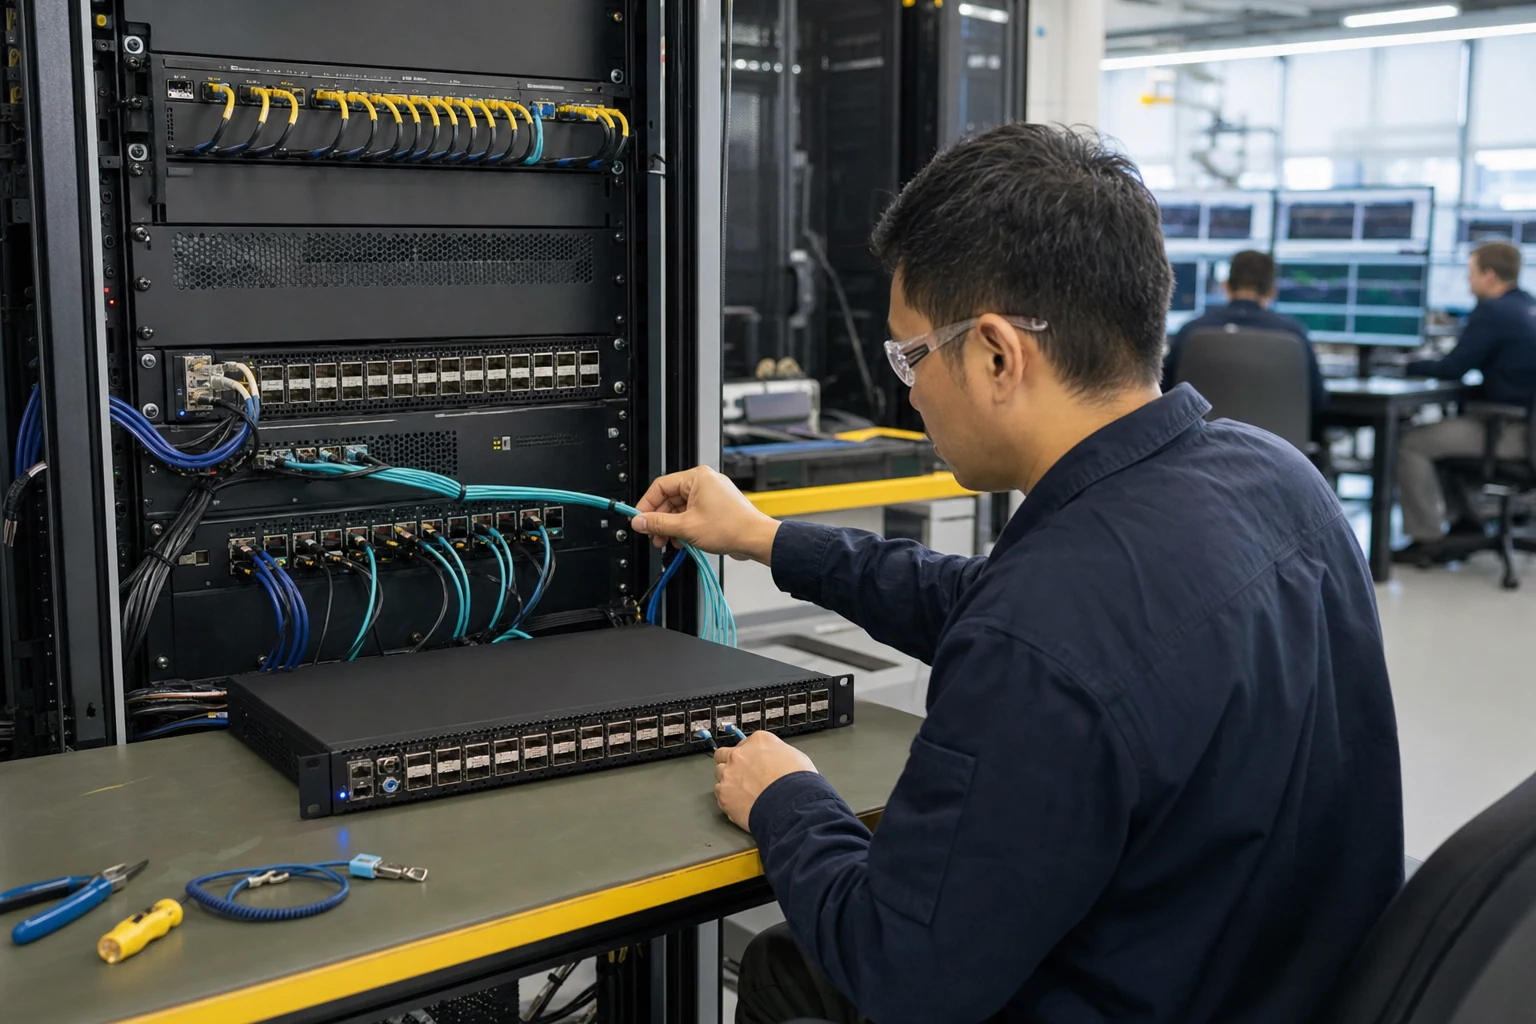
Engineering guidance on SONiC Switch Observability Is Leaving SNMP Behind for Australian infrastructure teams, covering form factor tradeoffs, capacity planning.
Key takeaways
- The networking industry is accelerating a transition away from legacy SNMP polling toward streaming telemetry and model-driven configuration for network device management.
- Together, these protocols represent a broader architectural pattern: separating the data model from the transport, enabling network operators to build automation pipelines that are portable across switch vendors and NOS platforms.
- Australian enterprises and service providers face several converging pressures that make observability automation a strategic priority:
What Is Happening
The networking industry is accelerating a transition away from legacy SNMP polling toward streaming telemetry and model-driven configuration for network device management. This shift is particularly visible in environments running SONiC (Software for Open Networking in the Cloud), the open-source network operating system originally developed by Microsoft and now governed by the Linux Foundation’s SONiC project.
Two open protocols sit at the center of this transition:
-
gNMI (gRPC Network Management Interface), defined by the OpenConfig initiative, enables real-time streaming of telemetry data from switches to collector platforms using gRPC and Protocol Buffers. Unlike SNMP, which relies on periodic polling and MIB-based data models, gNMI pushes structured, YANG-modelled data to receivers on a subscription basis.
-
NETCONF (Network Configuration Protocol), an IETF standard (RFC 6241), provides model-driven device configuration and state retrieval using YANG data models. Combined with tools like OpenConfig YANG models or vendor-native YANG modules, NETCONF allows network automation platforms to read and write switch configuration in a structured, validated, and transactional way.
Together, these protocols represent a broader architectural pattern: separating the data model from the transport, enabling network operators to build automation pipelines that are portable across switch vendors and NOS platforms.
Why It Matters for Australian Network Teams
Australian enterprises and service providers face several converging pressures that make observability automation a strategic priority:
-
Data center growth. Australia’s data center market continues to expand, driven by hyperscaler investment, sovereign data requirements, and AI/ML workload deployment. As fabric scale increases — particularly in spine-leaf architectures using 100G, 400G, and 800G links — manual SNMP-based polling cannot keep pace with the volume and granularity of telemetry data operators need.
-
AI fabric complexity. Organizations deploying GPU clusters for training and inference require lossless, low-latency fabrics with RoCE v2, DCBX, and congestion notification. Monitoring these fabrics demands sub-second telemetry visibility into queue depths, ECN marking, buffer utilization, and PFC frame counts — data that streaming telemetry via gNMI delivers natively but SNMP struggles to provide at the required cadence.
-
Skills and automation alignment. Australian network engineering teams increasingly work alongside DevOps and platform engineering functions. The move to gNMI and NETCONF aligns network operations with the same API-driven, infrastructure-as-code toolchains that compute and storage teams already use (Ansible, Terraform, Python/gNMI clients, Prometheus/Grafana observability stacks).
-
Open networking procurement criteria. As more Australian buyers evaluate SONiC-based switches as alternatives to incumbent vendor NOS platforms, observability protocol support becomes a first-class evaluation criterion alongside forwarding performance, port density, and power consumption.
The general networking literature confirms that network devices rely on communication protocols to transmit and exchange data, and that modern networks are designed for scalability, security, and IT operations efficiency. The specific application of gNMI and NETCONF within SONiC extends these principles into the programmable, model-driven observability layer that enterprise and data center operators now require.
gNMI vs. SNMP: The Technical Shift
Understanding the practical difference between legacy and model-driven observability helps explain why this shift is gaining momentum:
| Dimension | SNMP (Legacy) | gNMI Streaming Telemetry |
|---|---|---|
| Data model | MIB (ASN.1, vendor-specific) | YANG (structured, standardized) |
| Transport | UDP/161 (polling) | gRPC/TLS (subscription-based push) |
| Data format | OIDs, raw values | JSON or Protobuf, structured paths |
| Granularity | Periodic (minutes typical) | Sub-second, on-change capable |
| Scalability | Manager polls each device | Devices stream to collectors |
| Extensibility | MIB compilation required | YANG model updates, no recompilation |
For SONiC-based switches, gNMI support means that network operators can subscribe to real-time state data — interface counters, BGP neighbor state, LLDP topology, system health metrics — and feed it directly into time-series databases like Prometheus or InfluxDB, and visualization platforms like Grafana.
NETCONF complements gNMI on the configuration side. Rather than using CLI screen-scraping or custom API calls, NETCONF allows automation tools to read, validate, and apply configuration changes using YANG-modeled data with transactional semantics (confirmed commits, rollback on failure). For Australian enterprises running multi-vendor or multi-site SONiC fabrics, NETCONF provides a vendor-portable configuration interface that reduces platform-specific automation code.
The Observability Automation Stack
For teams evaluating SONiC-based switches with gNMI and NETCONF support, the typical open-source observability automation pipeline looks like this:
- Switch layer: SONiC NOS with gNMI server (telelemetryd) and NETCONF server exposing YANG-modeled state and configuration.
- Collection layer: gNMI collectors (e.g., gnmic, Telegraf with gNMI input plugin) subscribe to telemetry streams and write to time-series databases.
- Storage and query layer: Prometheus, InfluxDB, or VictoriaMetrics store time-series telemetry data.
- Visualization and alerting layer: Grafana dashboards display real-time fabric health; Alertmanager triggers notifications on threshold breaches or anomaly detection.
- Configuration automation layer: Ansible with NETCONF modules, Nornir with ncclient, or Terraform providers push validated configuration changes to SONiC switches.
This stack mirrors the observability patterns that IBM and other enterprise infrastructure providers describe for cloud networking environments, where automation, real-time monitoring, and AI-assisted anomaly detection are increasingly standard requirements. The IBM reference notes that AI and machine learning are transforming networking by enabling smarter, more adaptive systems that automate network management and optimize performance by predicting and responding to traffic patterns in real time — a capability that depends on having high-quality, high-frequency telemetry data in the first place.
For Australian buyers, the key evaluation question becomes: does the switch platform and its SONiC build provide the gNMI telemetry coverage and NETCONF configuration depth to support this full stack, or does it require proprietary extensions that lock the operator back into a single-vendor toolchain?
xSONiC Buyer Angle for Australia
For Australian enterprise and data center buyers evaluating xSONiC open networking platforms, the observability and automation story is a differentiator that should be tested during proof-of-concept trials:
-
Data center AI switches. Buyers deploying spine-leaf fabrics for AI/ML clusters should verify that gNMI telemetry covers RoCE v2 counters, PFC statistics, ECN marking, queue depth monitoring, and INT/IPTPath data paths. Real-time visibility into fabric congestion is a prerequisite for lossless RDMA operations.
-
Access and aggregation switches. Campus network teams should confirm NETCONF/YANG coverage for VLAN, PoE, ACL, MC-LAG, and policy-based routing configuration, and that gNMI telemetry streams cover interface status, PoE power budgets, and client session data.
-
Packet brokers. For network visibility deployments, telemetry automation enables dynamic filter rule management and traffic replication monitoring through the same model-driven interfaces used for the switching fabric.
-
AIDC Controller integration. Buyers using xSONiC’s AIDC Controller should ask how the controller consumes gNMI telemetry and pushes NETCONF configuration, and whether it provides a unified observability layer across mixed switch deployments.
The Australian market context matters here. With limited local network engineering talent pools compared to the US or Europe, automation and model-driven operations reduce the operational burden on smaller teams. Open, standards-based telemetry and configuration protocols also protect against vendor lock-in — a concern that becomes more acute as fabric scale grows and multi-year TCO calculations favor platforms that can be managed with portable toolchains.
What to Watch Next
Several developments are worth tracking for their impact on SONiC observability and automation in Australia:
-
SONiC community gNMI and NETCONF feature maturation. The SONiC project continues to expand YANG model coverage and improve telemetry density with each release. Buyers should track release notes for gNMI path additions and NETCONF capability updates.
-
OpenConfig model adoption. As OpenConfig YANG models gain wider adoption across NOS platforms, the portability benefits of model-driven telemetry increase. Australian buyers evaluating multi-vendor strategies should prioritize platforms with OpenConfig alignment.
-
AI-assisted network operations. The convergence of streaming telemetry with AI/ML-powered anomaly detection and intent-based networking is an active area of development. Platforms that provide clean, structured telemetry data now will be better positioned to leverage these capabilities as they mature.
-
Australian regulatory context. Data sovereignty and operational resilience requirements in sectors such as financial services, government, and healthcare may favor open, auditable observability stacks over proprietary NMS platforms. Standards-based telemetry supports compliance and audit workflows.
Engineering FAQ
How should NVMe form factor selection be made? Start with workload profile, usable capacity, serviceability, thermal envelope, write endurance, PCIe generation, slot layout, and replacement process. U.2, E1.S, M.2, and AIC devices solve different mechanical and operational problems.
What matters more than peak sequential speed? Sustained performance, thermal throttling behaviour, write endurance, latency under load, firmware stability, power-loss protection, and fleet manageability usually matter more than a single benchmark number.
How should storage be validated for AI or cloud workloads? Test the selected form factor in the real chassis with expected airflow, queue depth, write mix, temperature range, and monitoring stack. Validation should include steady-state and recovery behaviour, not only fresh-drive performance.
Related xSONiC Resources
Sources Reviewed
- IEEE 802.1Q Bridges and Bridged Networks
- IEEE 802.1AX Link Aggregation
- Ethernet Network Adapters - ConnectX NICs | NVIDIA
- NVIDIA BlueField Data Processing Unit
- NVIDIA Spectrum-X Ethernet Platform
- OpenConfig gNMI Specification
- OpenConfig
- RFC 7950 - The YANG 1.1 Data Modeling Language
- RFC 6241 - Network Configuration Protocol (NETCONF)
- ACSC Essential Eight
- OAIC Notifiable Data Breaches
- APRA CPS 234 Information Security
- NETSCOUT Network Packet Definition
- Cloudflare Network Packet Definition
- IEEE 802.11be Wireless LAN Standard
- IEEE 802.3bt Power over Ethernet
- SONiC Project Documentation
- Broadcom Ethernet Switching
- Marvell Switching
- NVIDIA Ethernet Switching
- Open Compute Networking
- SONiC GitHub
- SONiC Foundation
Product fit
Products referenced for evaluation
These products are referenced for evaluation context in the article. Confirm workload, port, optics, software, interoperability, and support requirements against the exact deployment before procurement.
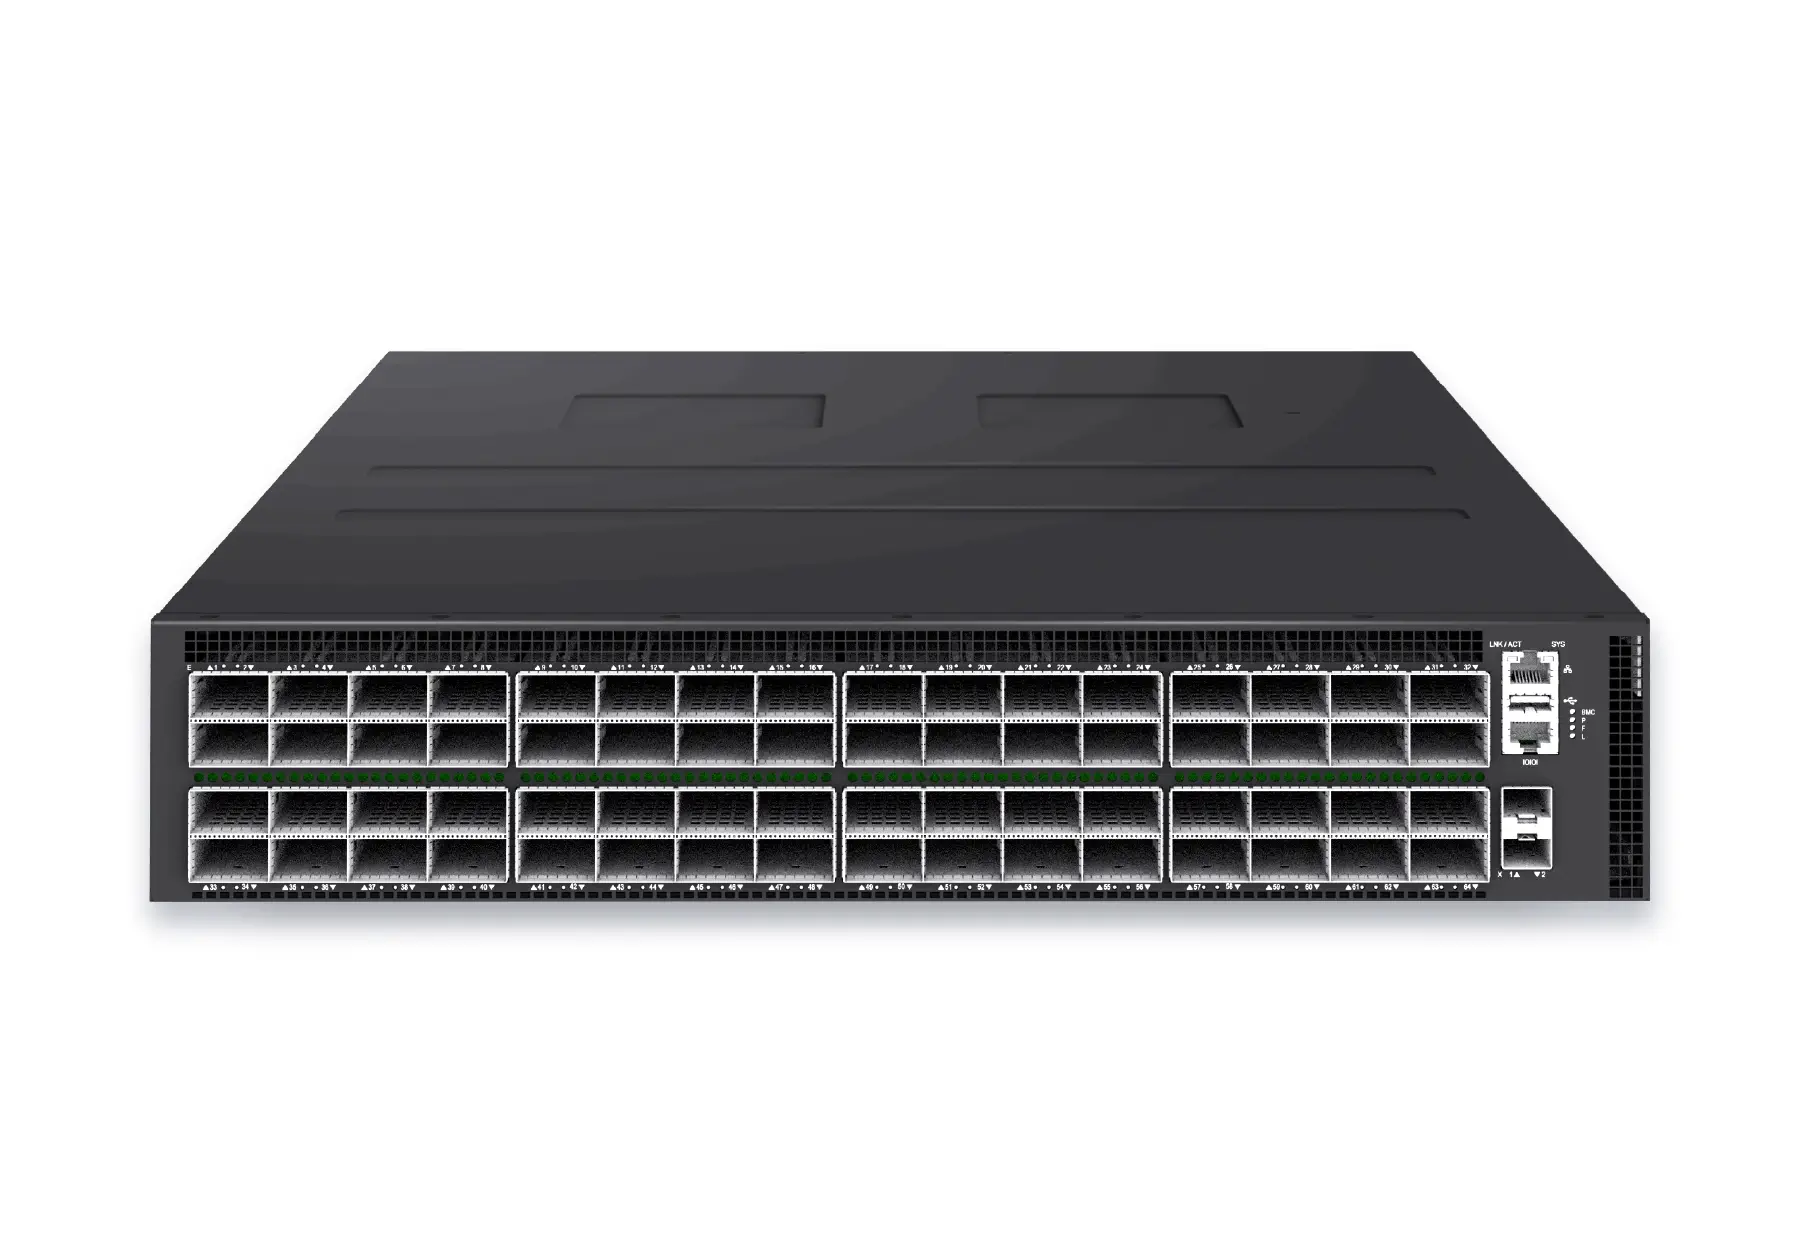 datacenter aiXS-DC-64X800-AI-G164-port 800G AI fabric switch for large-scale GPU clusters, HPC backbones, and ultra-high-throughput data center networks.View product
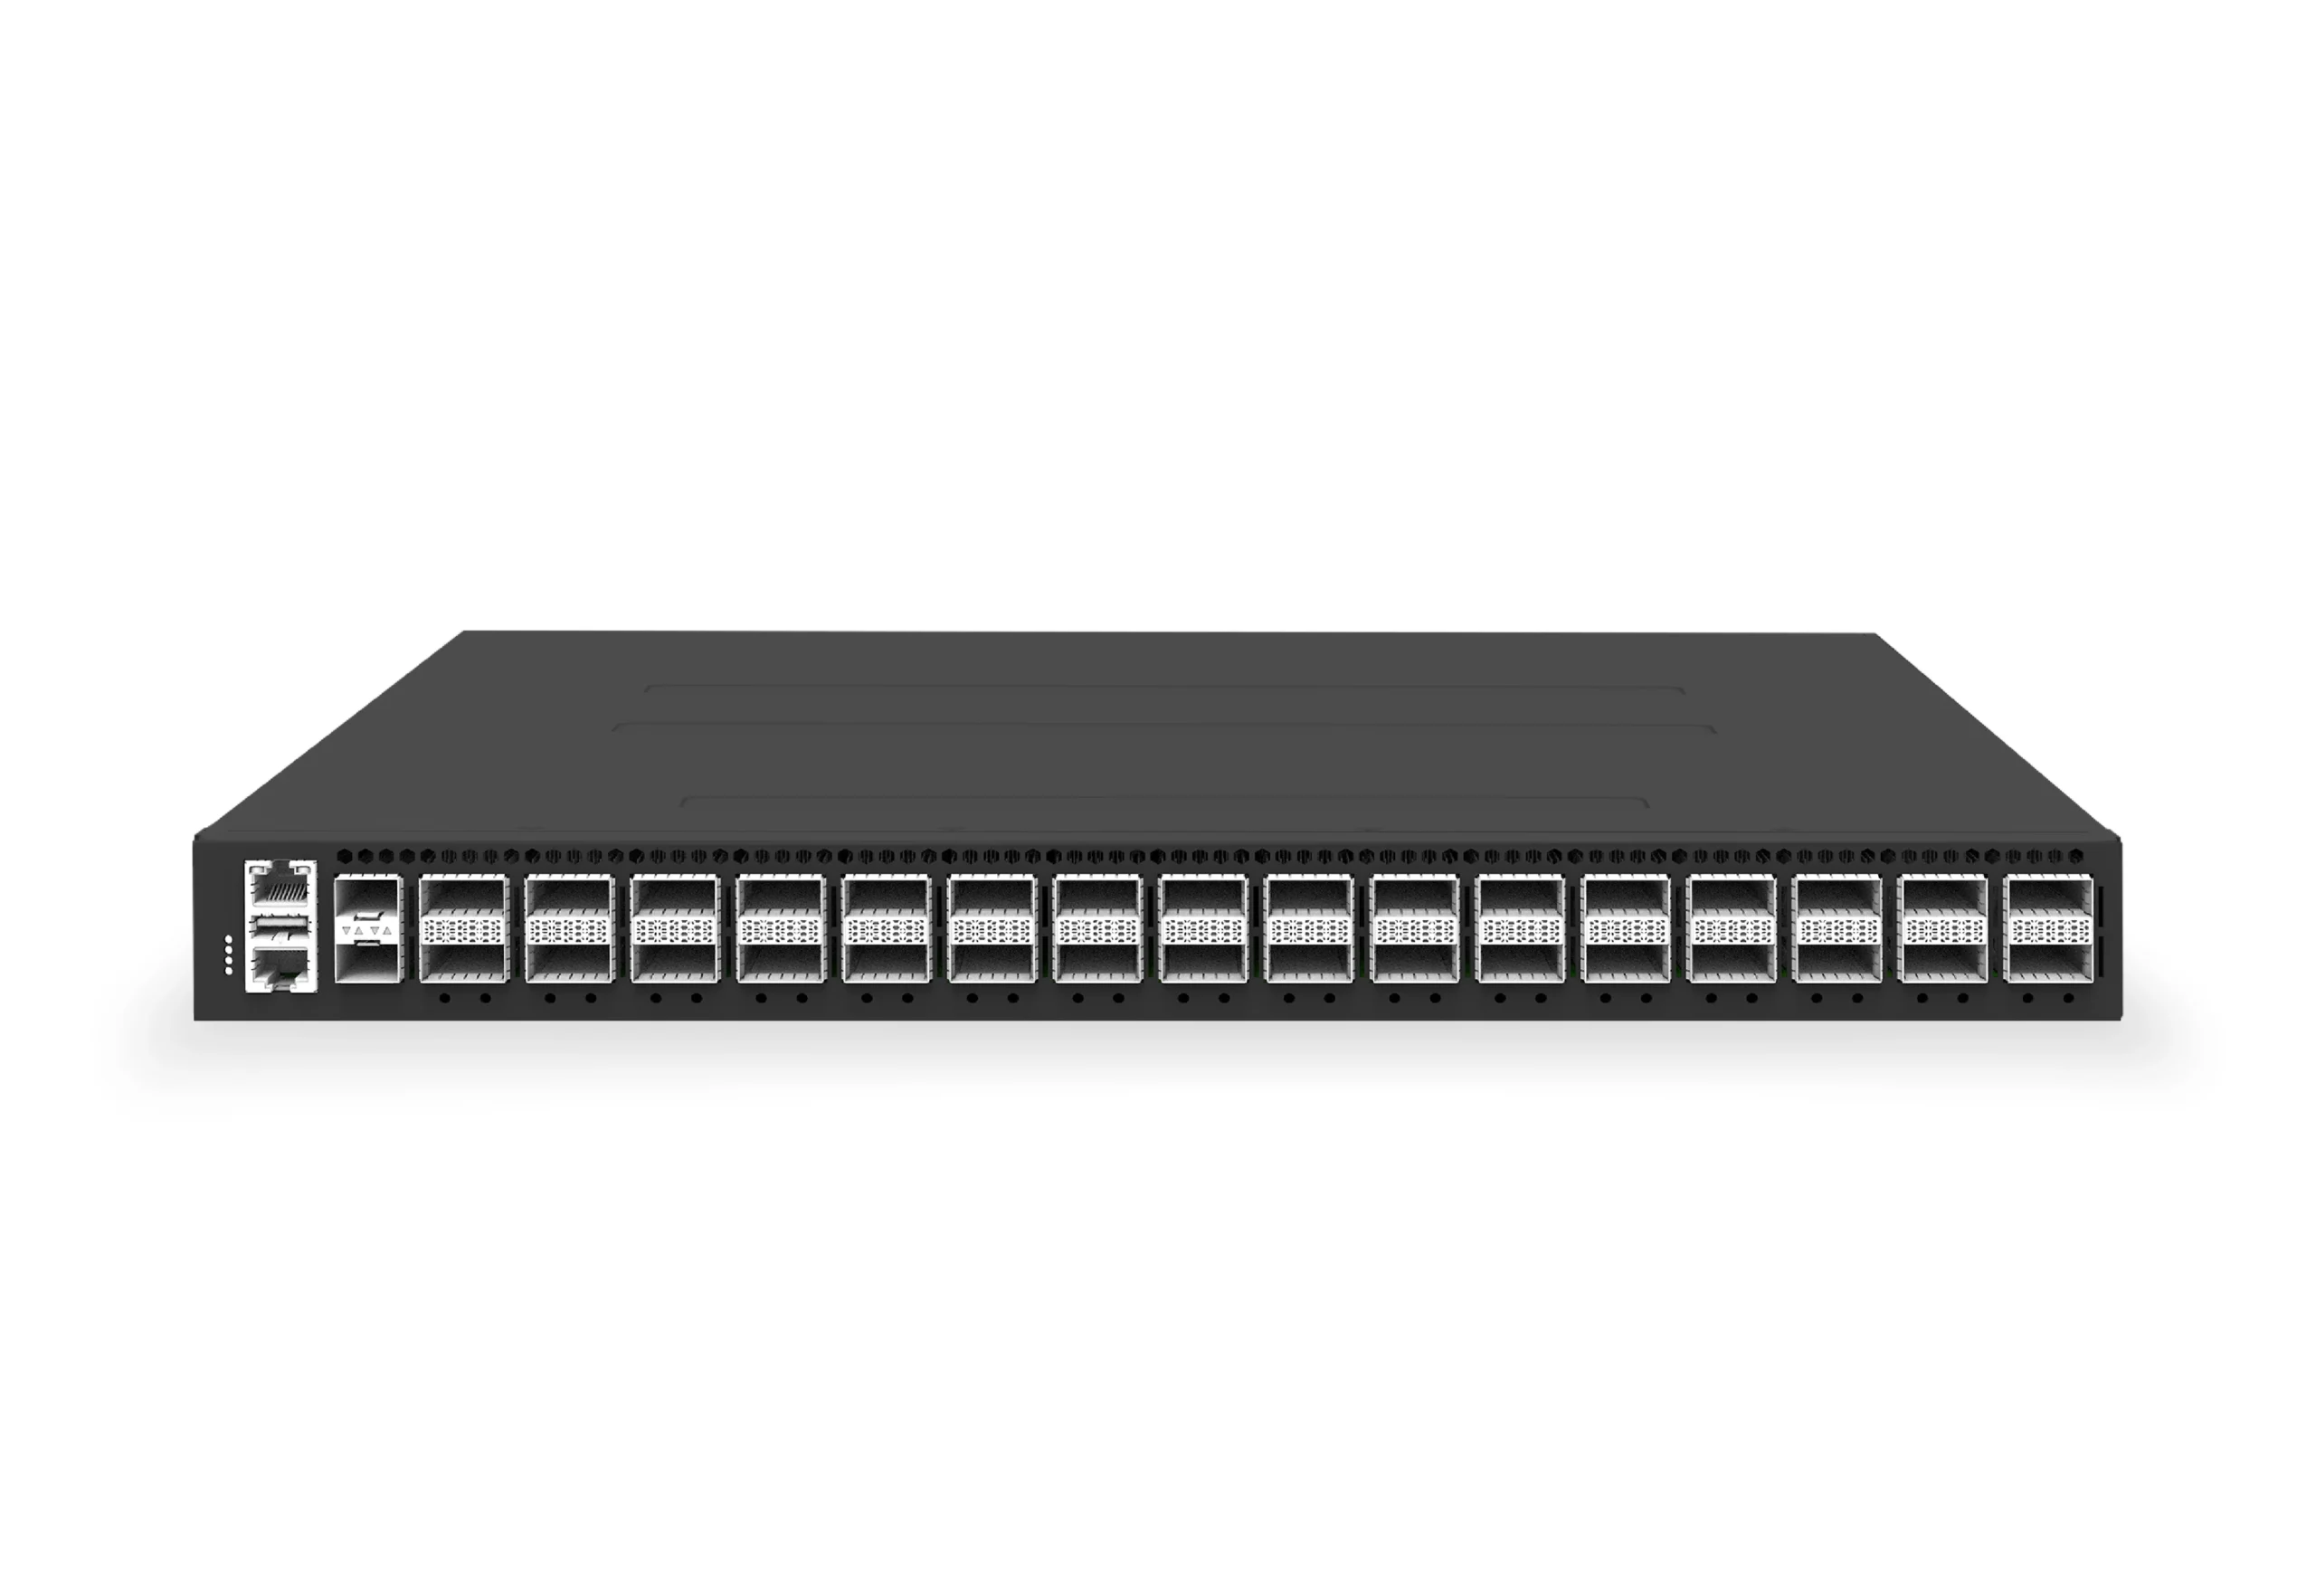 datacenter aiXS-DC-32X400-SP-G232-port 400G spine/core switch for high-capacity data center fabrics and AI-ready backbones.View product
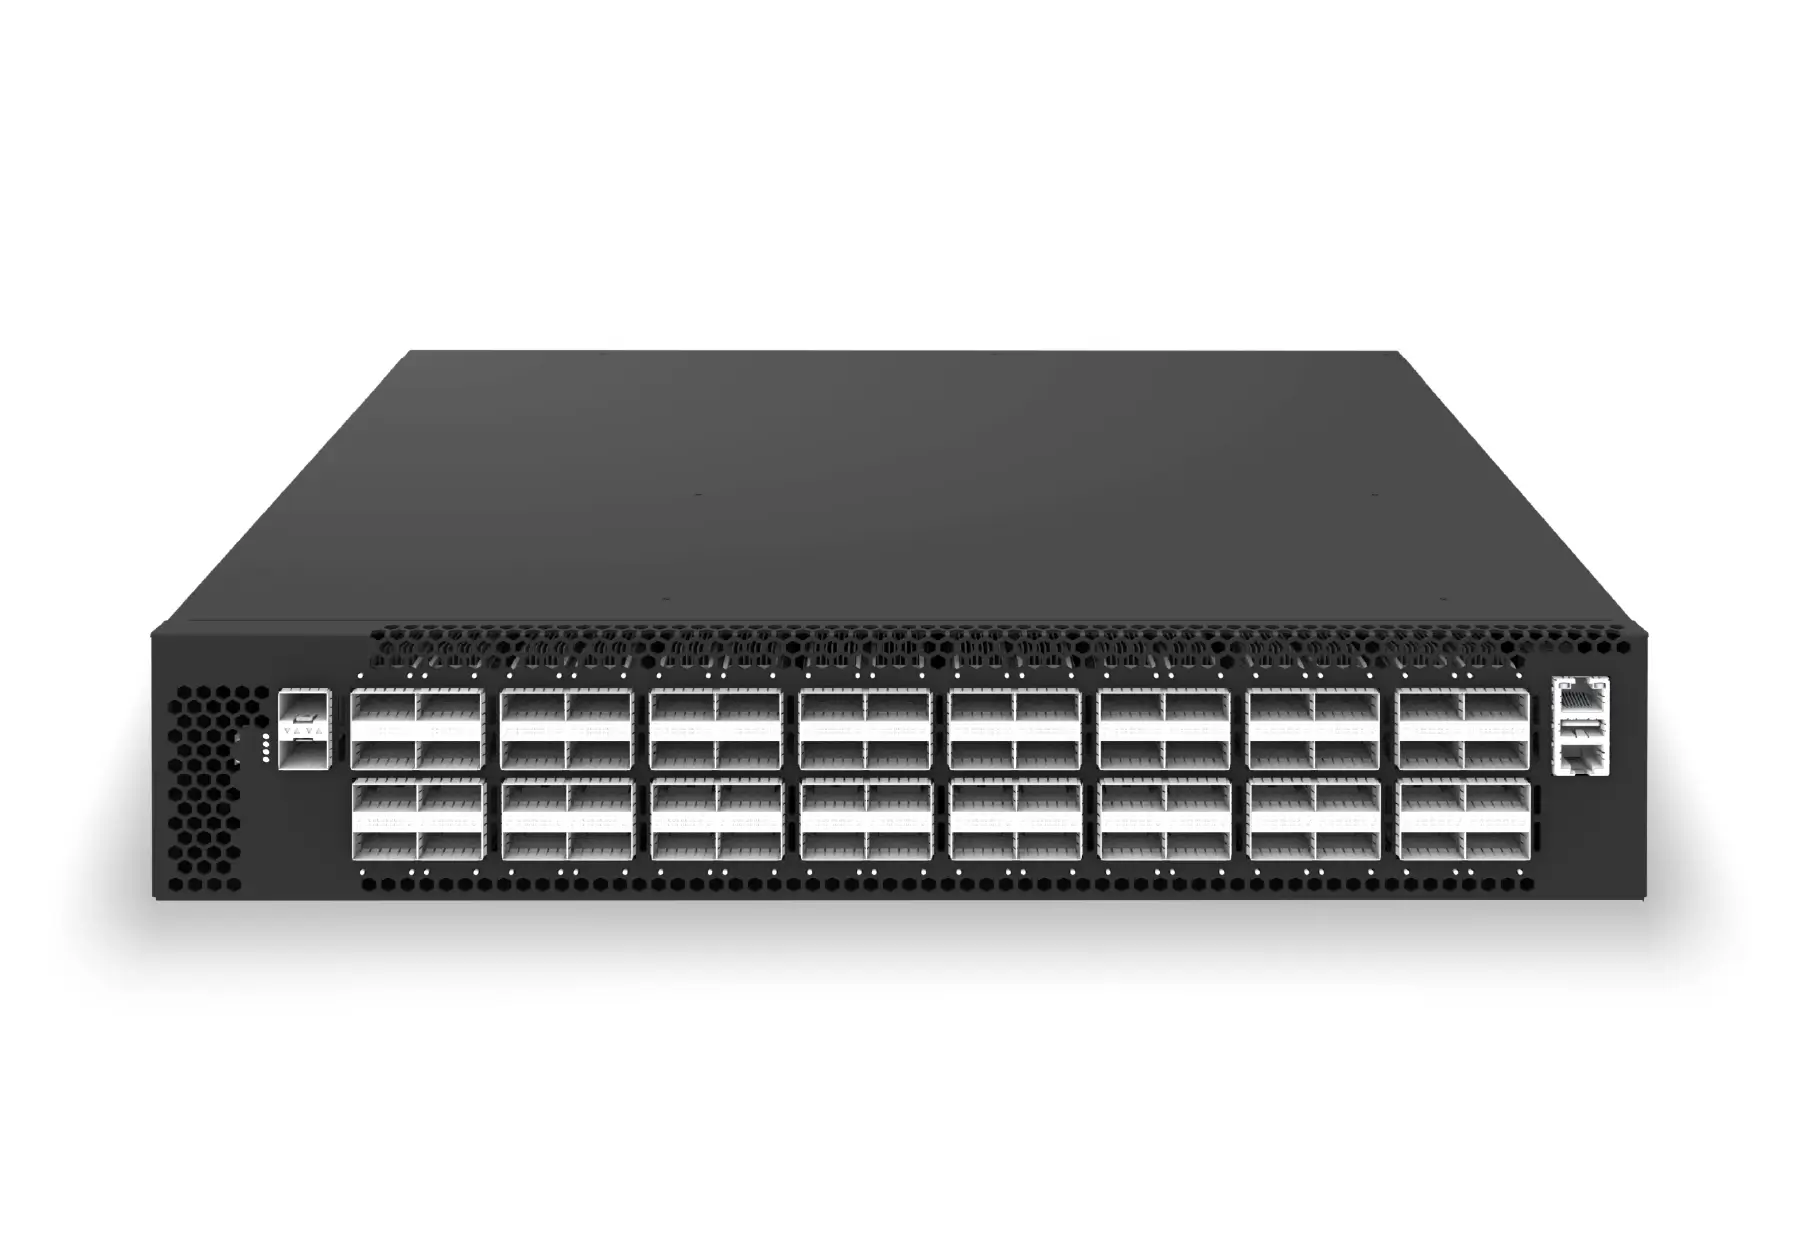 datacenter aiXS-DC-64X200-LS-G164-port 200G leaf/spine switch for high-bandwidth storage, compute, and scale-out data center fabrics.View product
Topic path
OpenConfig, gNMI, and NETCONF automation
This page focuses on:telemetry collection, subscriptions, pipeline operations, and observability outcomes rather than configuration transactions.
OpenConfig supplies vendor-neutral YANG data models, gNMI supplies Capabilities/Get/Set/Subscribe RPCs over gRPC, and NETCONF supplies XML-encoded configuration and state operations. Actual model and RPC coverage must be verified for the selected SONiC image and platform.
Continue reading
Related articles
 Technical ArticleWhat Enterprise Buyers Actually Get From Open Networking Support: A SONiC Reality CheckA SONiC support reality check for Australian enterprise buyers covering community, commercial distribution, hardware, integration, SLA, and escalation.Read article
 Technical ArticleWarm Reboot and Fast Reboot in SONiC: How to Validate High Availability Without a Full OutageEngineering guide to validating SONiC warm reboot and fast reboot, covering ASIC support, control-plane recovery, traffic loss, telemetry, and rollback.Read article
 Technical ArticleSONiC Security Hardening: A Practical Guide for Data Center Network TeamsA practical SONiC security hardening guide for data center teams covering management access, patching, logging, RBAC, image provenance, telemetry, and audit evidence.Read article