In brief
INT and path telemetry guidance for Australian AI data centers, covering hop-by-hop latency, queue depth, ECMP, RoCE, and telemetry validation.
Key takeaways
- AI training clusters and inference platforms generate traffic patterns that differ sharply from conventional enterprise or web-serving data centers.
- This visibility gap has real operational consequences. An AI training job running across dozens or hundreds of GPUs may stall silently because one hop in the spine-leaf fabric experienced momentary congestion that triggered RoCE congestion notifications.
- While INT is the broader framework, path telemetry refers specifically to the capability of reconstructing the forwarding path of a packet through the network based on the telemetry data collected.
Why AI Data Centers Break Traditional Network Monitoring
AI training clusters and inference platforms generate traffic patterns that differ sharply from conventional enterprise or web-serving data centers. GPU-to-GPU communication during distributed training creates intense east-west flows that are latency-sensitive, bursty, and often built on RoCE v2 or similar RDMA protocols that assume a lossless or near-lossless Layer 2 fabric. Traditional monitoring approaches — SNMP polling at 5-minute intervals, sampled flow exports via sFlow or NetFlow, and periodic LLDP-based topology discovery — operate on timescales of seconds to minutes. Microbursts that fill switch buffers, transient queue pressure that triggers Priority Flow Control (PFC) pauses, and asymmetric path changes can all occur and resolve within milliseconds. By the time a sampled flow record or SNMP counter update reaches a monitoring platform, the event is over and the root cause is buried in aggregated statistics.
This visibility gap has real operational consequences. An AI training job running across dozens or hundreds of GPUs may stall silently because one hop in the spine-leaf fabric experienced momentary congestion that triggered RoCE congestion notifications. Without per-hop, per-packet-level telemetry, the operations team sees a slow training epoch but cannot pinpoint which switch, which port, or which queue caused the problem. INT and path telemetry were designed to close exactly this gap.
What Is In-band Network Telemetry (INT)?
While INT is the broader framework, path telemetry refers specifically to the capability of reconstructing the forwarding path of a packet through the network based on the telemetry data collected. In practice, the two terms are often used together because INT metadata naturally enables path reconstruction: each hop appends its Switch ID and port information, so the sink can read the sequence of hops from source to destination.
Some vendors and open-source projects distinguish between:
- INT for latency and congestion: Focused on per-hop performance metrics like queue depth, hop latency, and buffer occupancy.
- Path telemetry for topology and fault isolation: Focused on identifying the exact forwarding path, detecting asymmetric routing, ECMP hash polarization, or unexpected path changes.
In an AI data center fabric, both use cases matter. Latency telemetry ensures that RoCE v2 flows are meeting their PFC and DCBX-configured quality targets. Path telemetry ensures that ECMP load balancing across spine switches is distributing traffic evenly and that no single spine is becoming a bottleneck due to hash collisions.
Path Telemetry vs. INT: Understanding the Distinction
RoCE v2 (RDMA over Converged Ethernet version 2) is the dominant protocol for GPU-to-GPU communication in AI training clusters. RoCE v2 relies on a lossless or near-lossless Ethernet fabric, typically enforced through Priority Flow Control (IEEE 802.1Qbb), Data Center Bridging Capability Exchange (DCBX, IEEE 802.1Qaz), and Explicit Congestion Notification (ECN). When congestion occurs, the fabric signals the sender to slow down using congestion notification packets (CNPs).
The problem is that PFC and ECN operate at the flow and queue level, but the root cause of congestion is often a specific hop, a specific port, or a specific microburst pattern that conventional counters cannot resolve in real time. INT provides the missing diagnostic layer:
- PFC storm diagnosis: PFC pause frames can propagate upstream and cause head-of-line blocking across multiple ports. INT queue depth and queue latency data at each hop help identify where PFC pauses originate and how they cascade.
- ECMP imbalance detection: In a leaf-spine fabric with 8 or 16 spine switches, ECMP hash distribution should be roughly even. INT path telemetry reveals whether certain spines are carrying disproportionate traffic.
- Microburst visibility: INT hop latency data, collected at per-packet granularity, captures microbursts that SNMP counters and even 1-second polling intervals miss entirely.
- DCBX and QoS verification: INT metadata can confirm that traffic is being classified into the correct queues and receiving the expected priority treatment at every hop.
For Australian data center operators building AI clusters — whether for research institutions, financial services, healthcare, or government — the ability to diagnose RoCE fabric issues without taking packet captures or performing intrusive debug operations is a significant operational advantage.
Why INT Matters Specifically for RoCE and Lossless Fabrics
Proprietary networking vendors often bundle telemetry capabilities with their controller ecosystems. While these solutions can be effective, they create a dependency: the telemetry pipeline, the analytics platform, and the network fabric are all locked to a single vendor’s hardware and software stack. This is a particular concern for AI data center operators who want flexibility in switch ASIC selection, NOS customization, and analytics tool integration.
Open networking platforms like xSONiC, built on Enterprise SONiC and open switching hardware, offer a different path:
- Programmable data planes: Switches based on programmable ASICs (such as Intel Tofino or Marvell Teralynx) can support INT natively in the forwarding pipeline, enabling line-rate telemetry collection without impacting switch performance.
- Open telemetry export: INT metadata can be exported to any standards-compliant analytics platform, whether open-source tools like Prometheus and Grafana, commercial AIOps platforms, or custom-built AI fabric dashboards.
- Multi-vendor flexibility: Because INT is an open framework, an xSONiC-based fabric can interoperate with other INT-capable switches from different vendors, avoiding the single-vendor lock-in that proprietary telemetry stacks impose.
This openness is especially relevant for Australian organizations that may need to comply with data sovereignty requirements, government procurement guidelines, or multi-vendor sourcing mandates. Open telemetry means the organization controls its observability stack rather than depending on a vendor’s proprietary analytics licensing.
Open Networking and INT: The xSONiC Advantage
Implementing INT in an AI data center fabric involves several architectural decisions:
1. INT Source and Sink Placement INT source functionality (inserting telemetry instructions into packet headers) can be configured on the access leaf switches where GPU servers connect, or on the servers themselves if the NIC supports INT insertion. INT sink functionality (stripping and collecting metadata) is typically configured on the destination leaf or on a dedicated telemetry collection switch.
2. Metadata Overhead and MTU Each INT hop adds metadata to the packet header. In a 3-tier Clos fabric with 2 spines, this means roughly 12-20 additional bytes per hop (depending on the metadata fields configured). Operators must ensure that the fabric MTU is large enough to accommodate the INT overhead without fragmenting RoCE traffic, which cannot tolerate fragmentation.
3. Telemetry Volume and Collector Capacity INT generates telemetry at per-packet granularity. In a busy AI training cluster with hundreds of GPUs generating 100G or 400G flows, the volume of telemetry data can be substantial. Operators need to plan collector capacity, consider sampling strategies for INT metadata (even if the packets themselves are not sampled), and decide whether to export all INT data or only data from packets that exceeded latency or queue depth thresholds.
4. ASIC and Pipeline Support Not all switch ASICs support INT natively. Support depends on the specific forwarding pipeline (fixed-function vs. programmable) and the NOS capabilities. Operators evaluating xSONiC bare-metal switch platforms should confirm INT support at the ASIC level before designing their telemetry architecture.
Deploying INT in a Leaf-Spine AI Fabric: Practical Considerations
INT is not the only way to gain visibility into AI data center fabrics. Alternative or complementary approaches include:
- Streaming telemetry (gNMI/gRPC): Push-based telemetry that streams interface counters, queue statistics, and system state at configurable intervals. Faster than SNMP polling but still operates at interval granularity, not per-packet.
- Packet mirroring and capture: SPAN/RSPAN/ERSPAN can mirror traffic to a packet broker or capture appliance for deep analysis. Effective for troubleshooting but not practical for continuous monitoring at fabric scale.
- eBPF-based host telemetry: Tools running on GPU servers can instrument network behavior at the host level using eBPF. Complementary to INT but does not provide visibility into switch-internal behavior.
- sFlow with extended headers: sFlow can carry additional metadata in its extended switch and router headers. Less granular than INT but available on a wider range of switch platforms.
The strongest AI fabric observability strategy combines multiple approaches. INT provides the per-packet, per-hop foundation. Streaming telemetry provides continuous counter and state monitoring. Packet brokers (see xSONiC packet broker products) provide the aggregation and filtering layer for security tools and deep packet inspection.
INT vs. Alternative AI Fabric Observability Approaches
If you are building or refreshing an AI data center fabric in Australia, INT and path telemetry should be part of your observability planning from the design stage, not an afterthought. The core benefits are:
- Root cause isolation in milliseconds, not minutes. When a training job stalls, INT data tells you exactly which hop, which queue, and which port caused the problem.
- ECMP and load balancing validation. Confirm that your spine-leaf fabric is distributing traffic as designed, rather than relying on assumptions about hash distribution.
- RoCE fabric health monitoring. Correlate INT hop latency and queue depth data with PFC pause events, ECN marks, and CNP rates to maintain lossless fabric behavior.
- Open, vendor-neutral telemetry. With xSONiC’s open networking approach, you control the telemetry pipeline end-to-end, from INT-capable switches to your choice of analytics platform.
The investment in INT-capable infrastructure pays off the first time your operations team needs to diagnose a fabric issue during a multi-day training run. Without it, you are debugging with incomplete data.
For more on xSONiC’s approach to AI fabric design, see our AI Fabric solution guide and INT Technology pillar page. To discuss INT-capable switch options for your deployment, contact the xSONiC team.
INT and Path Telemetry Acceptance Matrix
| Telemetry area | Acceptance evidence | Rework trigger |
|---|---|---|
| Hop-by-hop latency | INT captures switch ID, ingress port, egress port, queue depth, and hop latency across at least 2 leaf and 2 spine switches | A slow AI job cannot be tied to a specific hop, queue, or ECMP path |
| RoCE fabric correlation | PFC pause, ECN mark, CNP event, queue occupancy, and RDMA flow data correlate within a 30-second window | Operators cannot separate compute, storage, and network causes during a training slowdown |
| MTU and metadata overhead | INT metadata overhead tested against 9,000-byte jumbo MTU and RoCE traffic without fragmentation | Telemetry insertion changes the packet path or breaks RDMA behavior |
| Collector capacity | Collector ingest, retention, alerting, and sampling policy tested with 100G, 400G, or 800G traffic profiles | Telemetry volume overwhelms the collector or hides burst events |
| Operations | Runbook includes baseline, failure test, rollback, dashboard, and escalation owner | INT is enabled as a feature but not usable during an incident |
Engineering FAQ
When does INT add more value than streaming telemetry alone? INT adds value when the team needs per-hop evidence for microbursts, ECMP imbalance, queue buildup, or RoCE congestion events that happen faster than normal polling intervals.
What should be validated before enabling INT in production? Validate metadata overhead, MTU, collector capacity, switch ASIC support, export format, alert thresholds, and rollback on the same 100G, 400G, or 800G fabric planned for production.
Why does path telemetry matter for AI fabrics? Path telemetry shows which leaf, spine, port, and queue carried a flow. That evidence is essential when a training job slows down but ordinary counters show only aggregate utilisation.
Related xSONiC Resources
Sources Reviewed
- xSONiC INT Technology for AI Data Center Telemetry
- xSONiC IPTPath Path Telemetry
- xSONiC AI Fabric Observability Context
- Ethernet Network Adapters - ConnectX NICs | NVIDIA
- NVIDIA BlueField Data Processing Unit
- NVIDIA Spectrum-X Ethernet Platform
- OpenConfig gNMI Specification
- OpenConfig
- RFC 7950 - The YANG 1.1 Data Modeling Language
- RFC 6241 - Network Configuration Protocol (NETCONF)
- ACSC Essential Eight
- OAIC Notifiable Data Breaches
- APRA CPS 234 Information Security
- NETSCOUT Network Packet Definition
- Cloudflare Network Packet Definition
- SONiC Project Documentation
- Broadcom Ethernet Switching
- Marvell Switching
- NVIDIA Ethernet Switching
- Open Compute Networking
- SONiC GitHub
- SONiC Foundation
Product fit
Products referenced for evaluation
These products are referenced for evaluation context in the article. Confirm workload, port, optics, software, interoperability, and support requirements against the exact deployment before procurement.
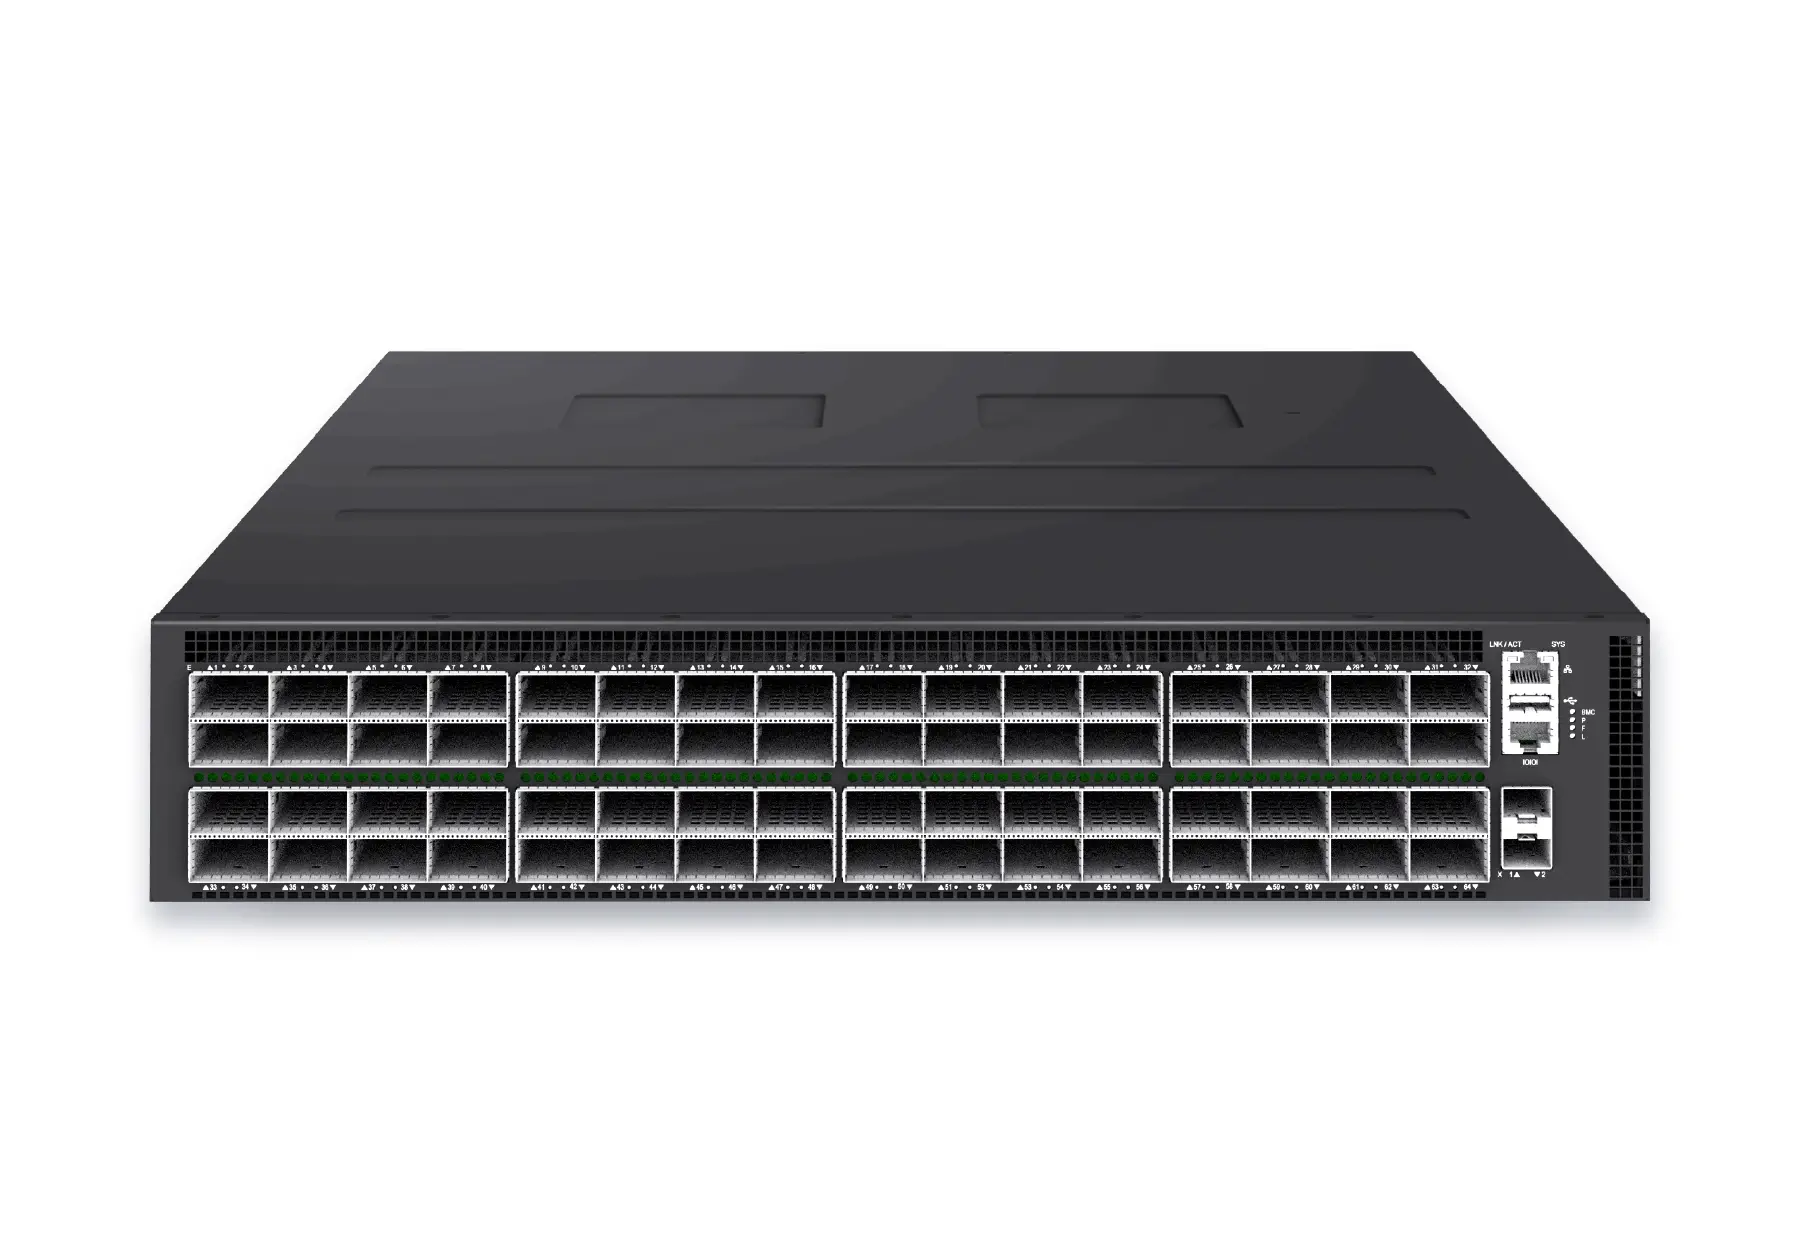 datacenter aiXS-DC-64X800-AI-G164-port 800G AI fabric switch for large-scale GPU clusters, HPC backbones, and ultra-high-throughput data center networks.View product
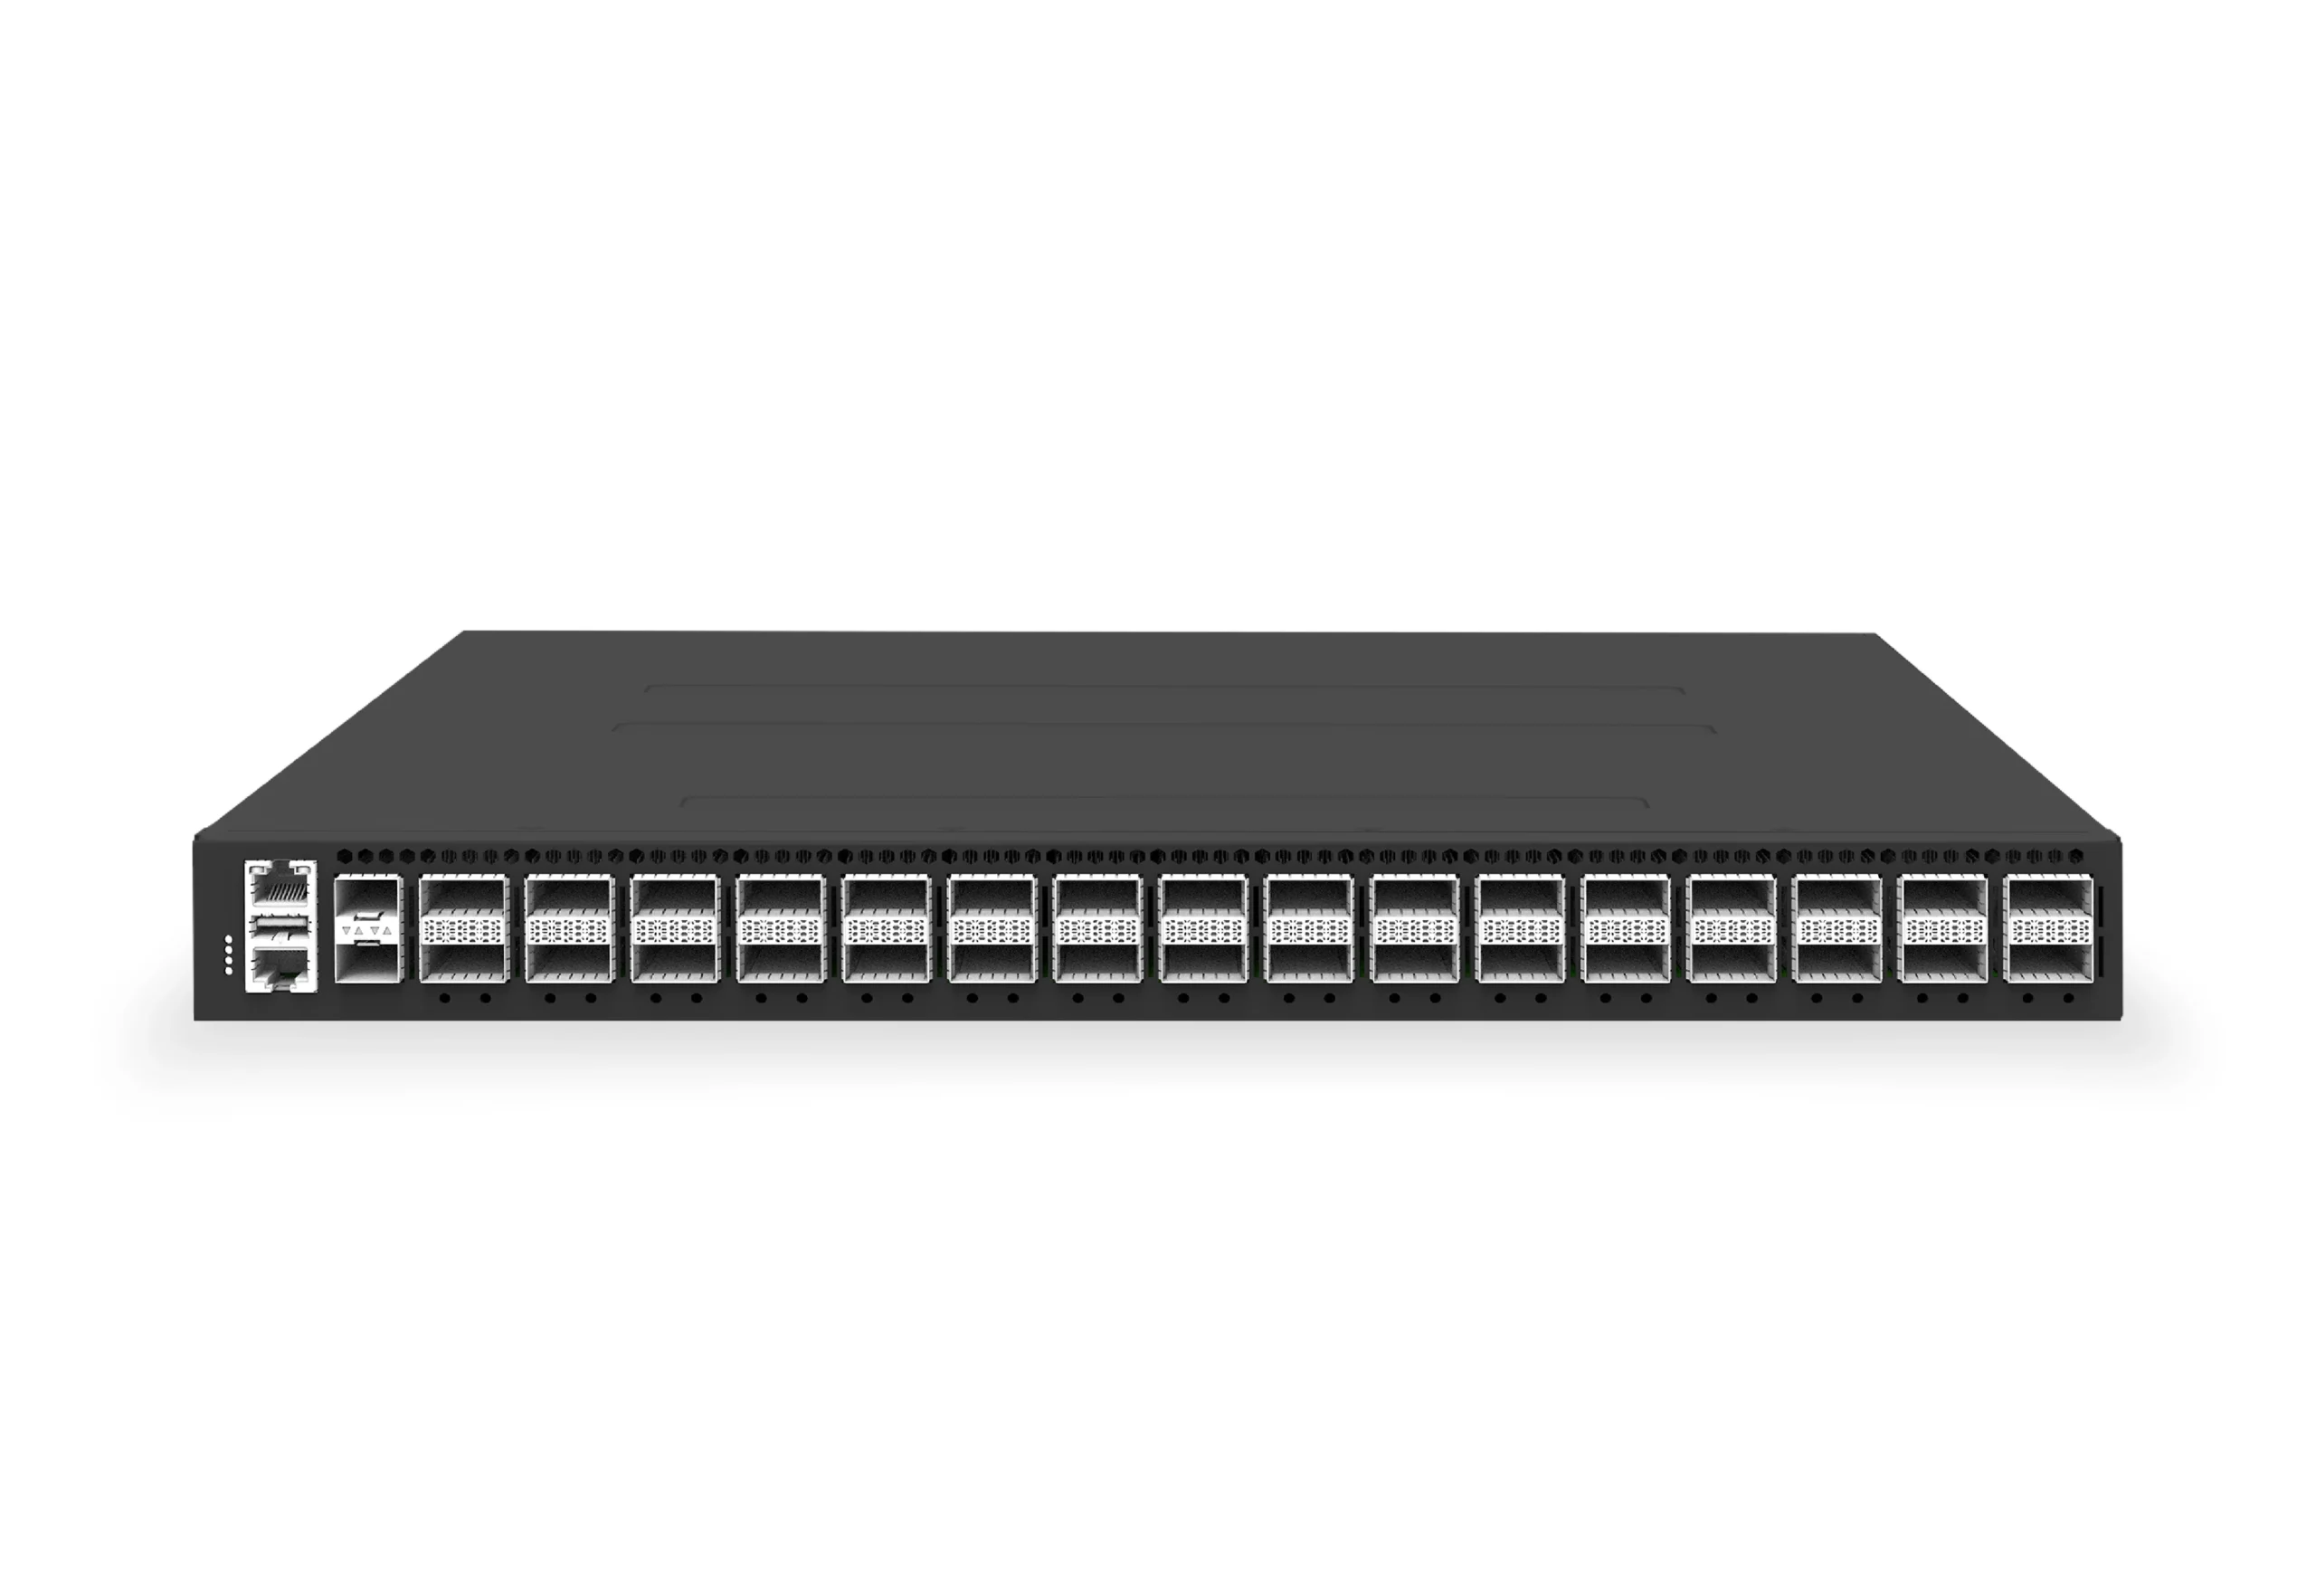 datacenter aiXS-DC-32X400-SP-G232-port 400G spine/core switch for high-capacity data center fabrics and AI-ready backbones.View product
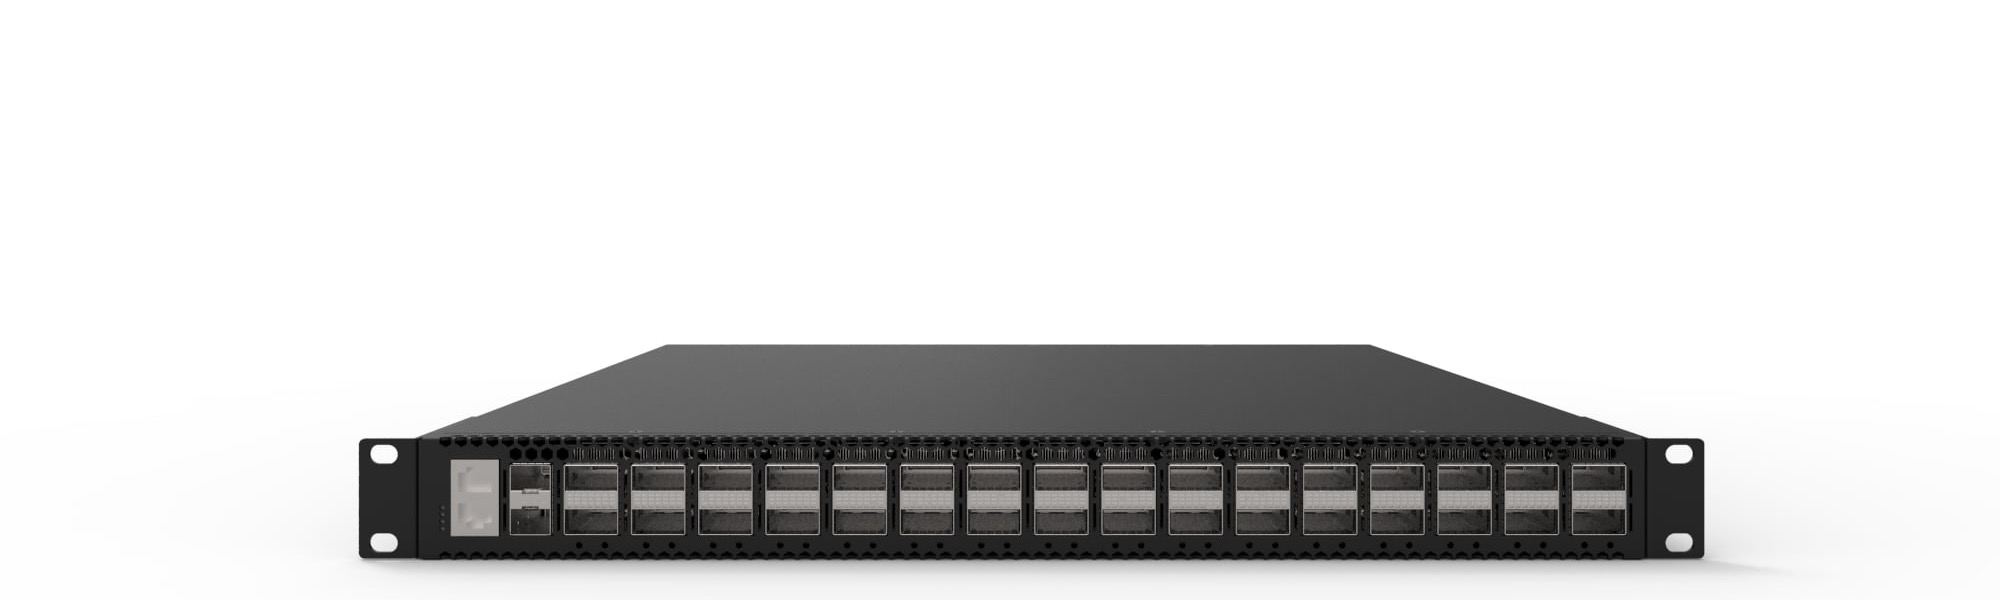 packet brokerXS-PB-32X400-G132x400G network packet broker for backbone-scale traffic visibility, filtering, replication, and high-performance tool delivery.View product
Continue reading
Related articles
 Technical ArticleWhere Your Packets Disappear: A Visibility Gap Analysis for Australian Security and Observability TeamsEngineering guide for packet broker and visibility planning covering traffic capacity, filtering, tool delivery, resilience, and audit evidence.Read article
 Technical ArticlePacket Broker Filtering, Replication, and Load Balancing for Visibility ArchitectureTechnical guide to packet broker filtering, replication, and load balancing for Australian visibility, security, and AI fabric monitoring.Read article
 Technical ArticlePacket Broker vs Network TAP Aggregation for Security Visibility: Which Layer Do You Need?A practical architecture comparison of network TAPs and packet brokers for security visibility, tool delivery, traffic aggregation, and Australian data centre operations.Read article