Australian-made deployment scope
Architecture review, solution configuration, validation planning, documentation, and commercial accountability are handled in Australia.
Data Center Solution
Capture the hidden queue and delay signals that classic polling misses.
In-band Network Telemetry (INT) gives the network a way to report path and device conditions with much finer granularity than traditional periodic polling. For AI and HPC fabrics, this matters because packet drops, microbursts, and short delay spikes can harm distributed jobs long before average utilization or SNMP counters make the issue obvious.
xSONiC INT planning focuses on capturing the right event at the right place: buffer drops, high forwarding delay, queue pressure, and path-level quality signals that help operators isolate the device, queue, or link causing trouble.
| Monitoring Method | Strength | Limitation in AI Fabrics |
|---|---|---|
| SNMP polling | Simple and widely understood. | Polling intervals often miss microbursts and short-lived queue events. |
| Interface counters | Good for loss and utilization summaries. | Counters do not explain which path, queue, or flow caused the event. |
| Flow logs | Useful for traffic attribution. | May not include queue depth or forwarding delay at each hop. |
| INT-style telemetry | Captures path and device state closer to the packet event. | Requires planning for sampling, collectors, and data volume. |
| Solution | Trigger | Captured Information | Recommended Fit |
|---|---|---|---|
| BDC | Buffer drop or queue overflow condition. | Queue occupancy and drop context. | Packet-loss root cause analysis. |
| HDC | Forwarding delay reaches a configured threshold. | Delay, queue, and path context. | High-latency diagnosis in lossless networks. |
| IPT | Selected traffic is sampled or replicated across a telemetry domain. | Path statistics and per-node observations. | End-to-end path quality monitoring. |
Buffer Drop Capture is useful when packet loss appears but the operator needs to know where and why it happened. Instead of only recording that a port dropped packets, BDC-style telemetry associates the event with queue state and traffic context.
Microburst arrives
      |
Queue exceeds safe depth
      |
Drop or overflow event occurs
      |
Telemetry record captures queue and path context
      |
Collector correlates event with workload and topology
High Delay Capture focuses on packets that experience unusual forwarding delay. This is valuable in lossless fabrics because packets may not be dropped, but long queueing delay can still damage application performance.
| Symptom | Possible Cause | HDC Value |
|---|---|---|
| Training step time increases | Queue buildup on shared path. | Identifies the node and queue where delay appears. |
| Storage latency spikes | Congestion near storage leaf or spine. | Shows whether the delay is localized or path-wide. |
| PFC pause increases | Lossless class is under pressure. | Correlates pause behavior with forwarding delay. |
xSONiC switches
      |
      v
Telemetry sampling or event capture
      |
      v
Encapsulation and export
      |
      v
Collector receives structured event data
      |
      v
Dashboard / alerting / root cause workflowINT-style visibility is most useful on xSONiC data center switches used in RoCEv2, storage, and AI backend fabrics. 400G and 800G fabrics benefit because traffic can create high queue pressure quickly, while 100G and 200G networks benefit during staged migration and troubleshooting.
INT should be deployed only where the telemetry value exceeds the packet overhead and operational complexity. Validate 3 representative paths, 2 packet sizes, and one congestion event. Compare INT metadata against interface counters, queue telemetry, and application timing so the team knows which signal is authoritative during an incident.
| Check | Evidence to collect | Reject condition |
|---|---|---|
| Metadata accuracy | Hop path, queue depth, timestamp, and egress-port records. | INT records contradict switch counters or omit a critical hop. |
| Overhead control | Packet size impact, sampling rate, collector load, and storage rate. | Telemetry traffic creates measurable user-traffic impact. |
| Incident workflow | Alert, query, and root-cause replay for one congestion event. | Operators cannot use the data to localize the failure within one path. |
No. INT has packet, collector, and operations cost. Start with the fabric segments where microbursts, queue delay, or path ambiguity create real incident risk: GPU backend paths, storage paths, and high-value service boundaries. Expand only after the collector and runbook can handle the data rate.
The telemetry record should agree with independent signals: interface counters, queue telemetry, route or ECMP state, and application timing. If INT metadata shows one path but counters or packet captures show another, fix the telemetry scope before using it for production incident decisions.
Australian-Made Deployment Scope
Architecture review, solution configuration, validation planning, documentation, and commercial accountability are handled in Australia.
Switching, optics, storage, server, and packet visibility components are selected against port speed, OS, telemetry, power, and deployment requirements.
The bill of materials is checked against RFP requirements, rollback path, optics compatibility, support model, and export screening before order release.
xSONiC supports international buyers through Australian project ownership, acceptance evidence, documentation, and post-delivery escalation.
Related Products
Use these related platforms as a starting point for sizing, comparison, and follow-up discussion.
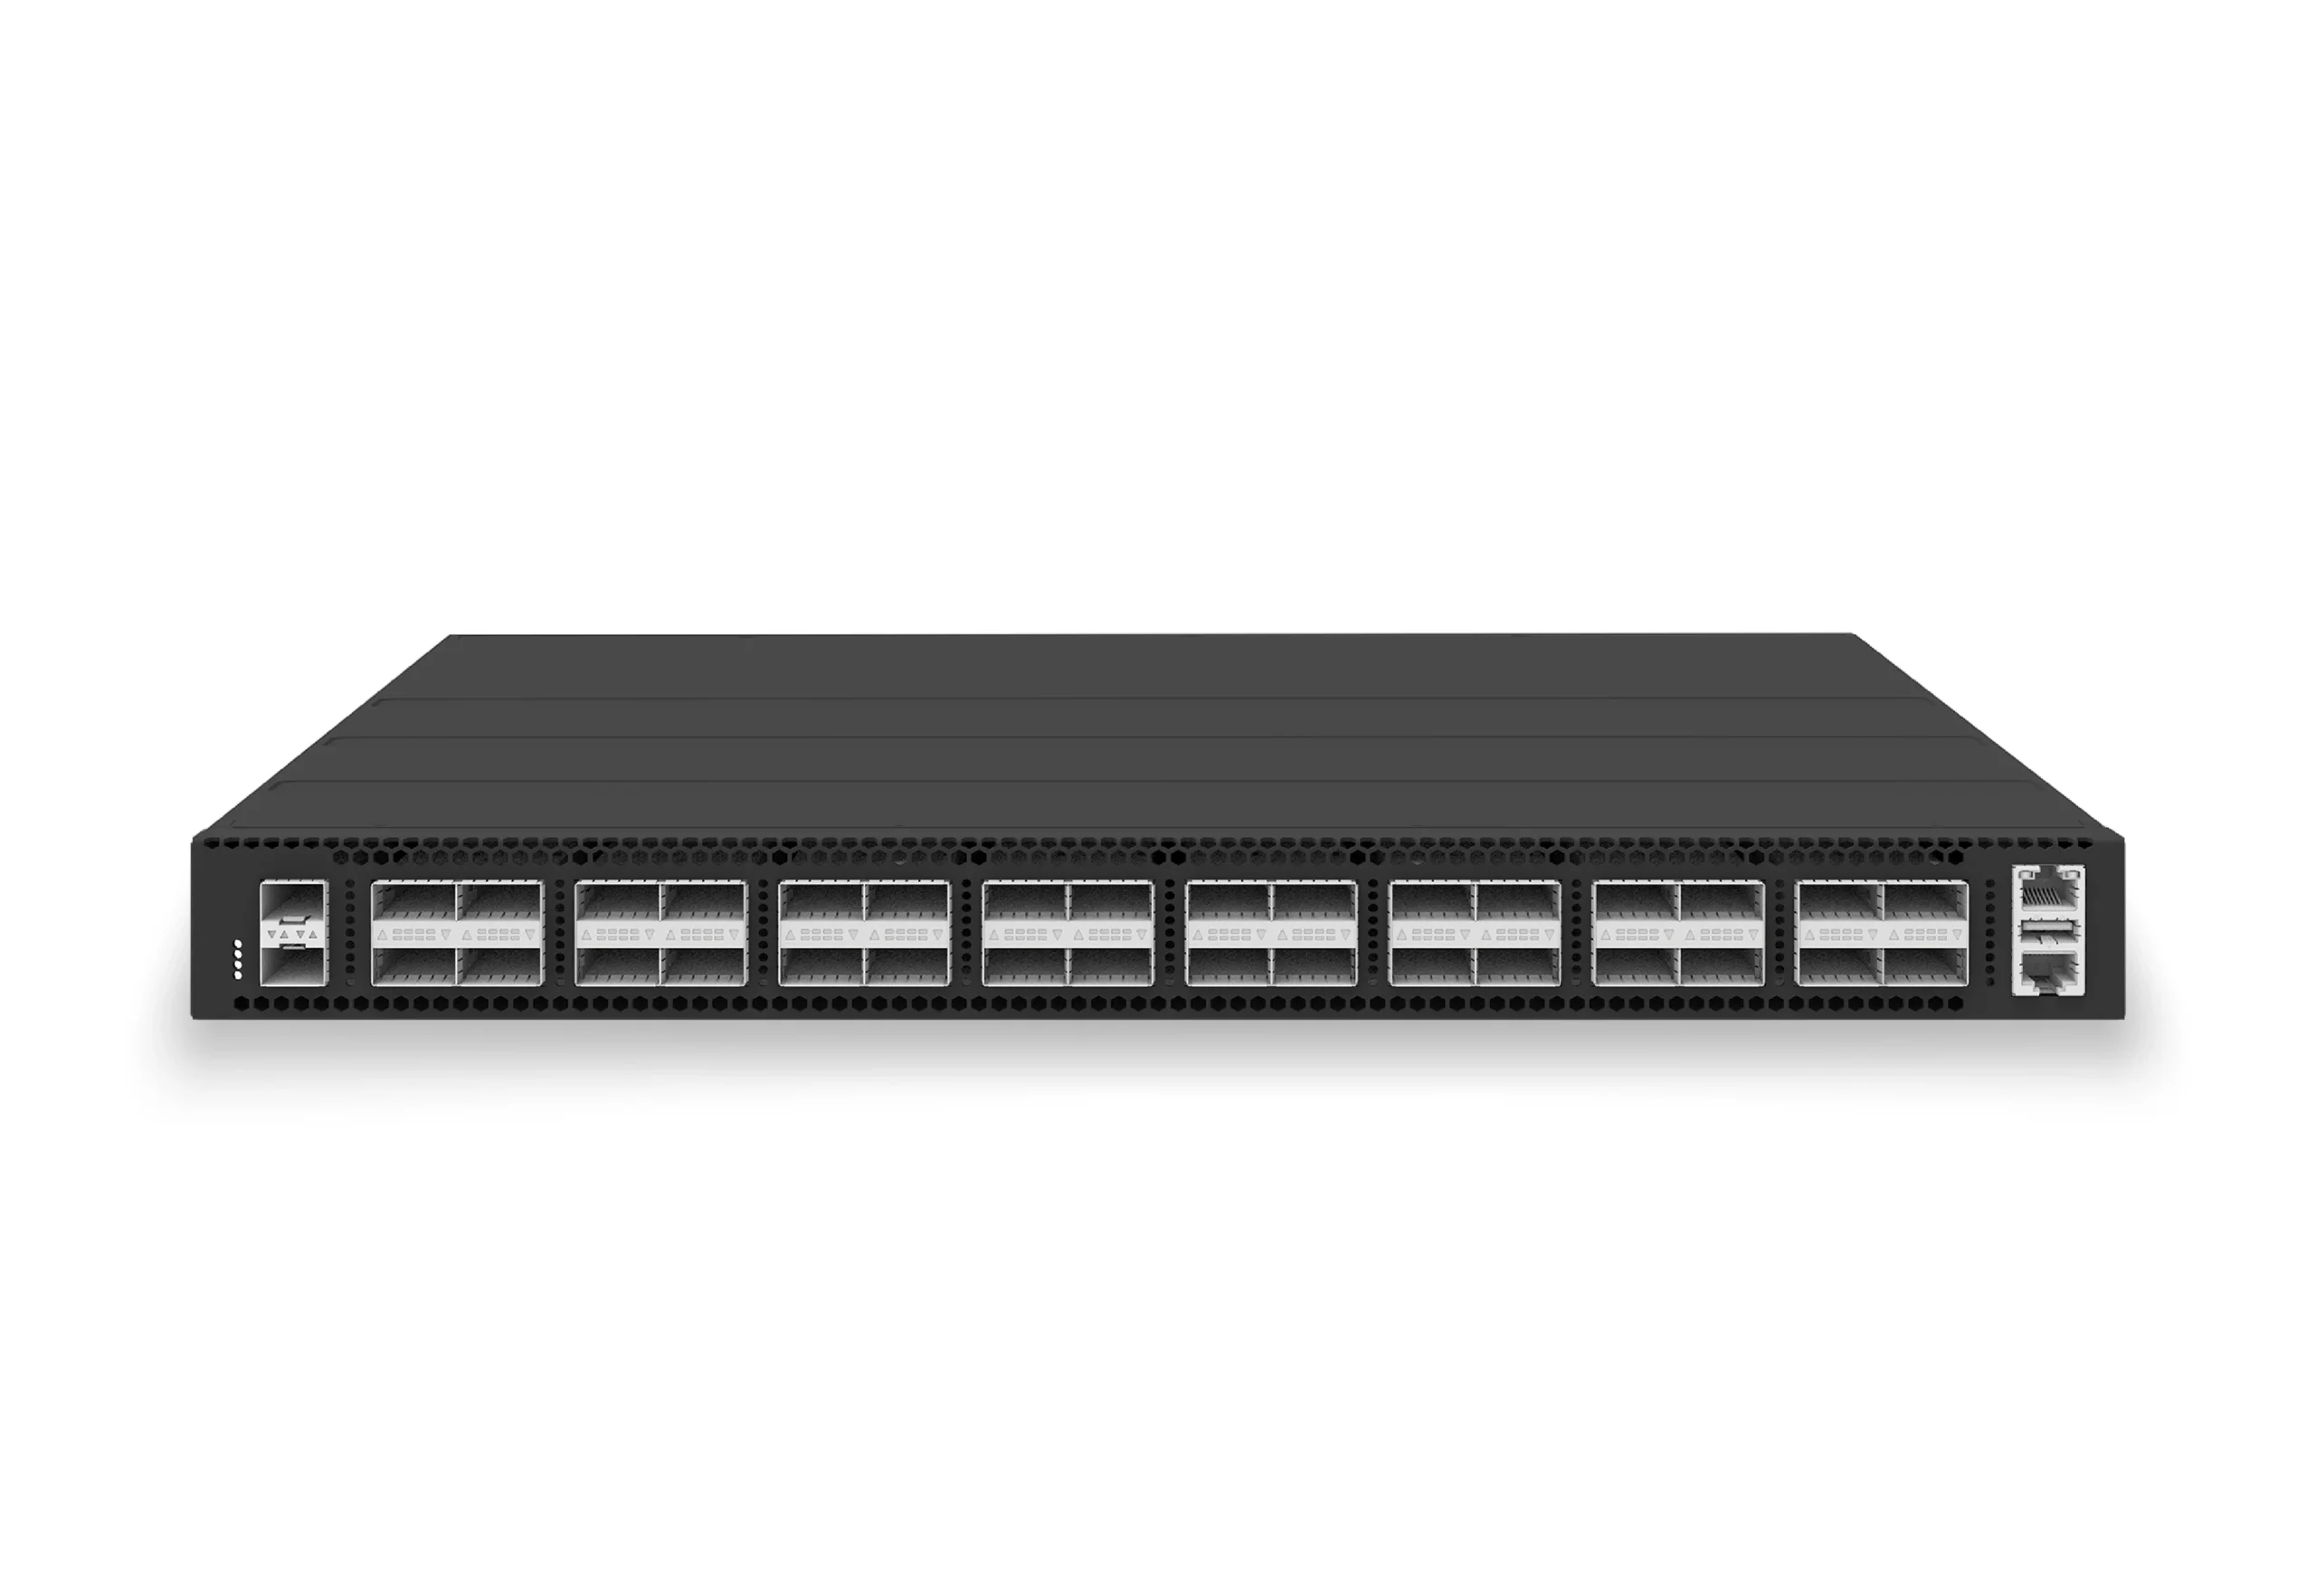
32-port 100G leaf/spine switch for VXLAN fabrics, RoCE-ready workloads, and tenant-scale routing.
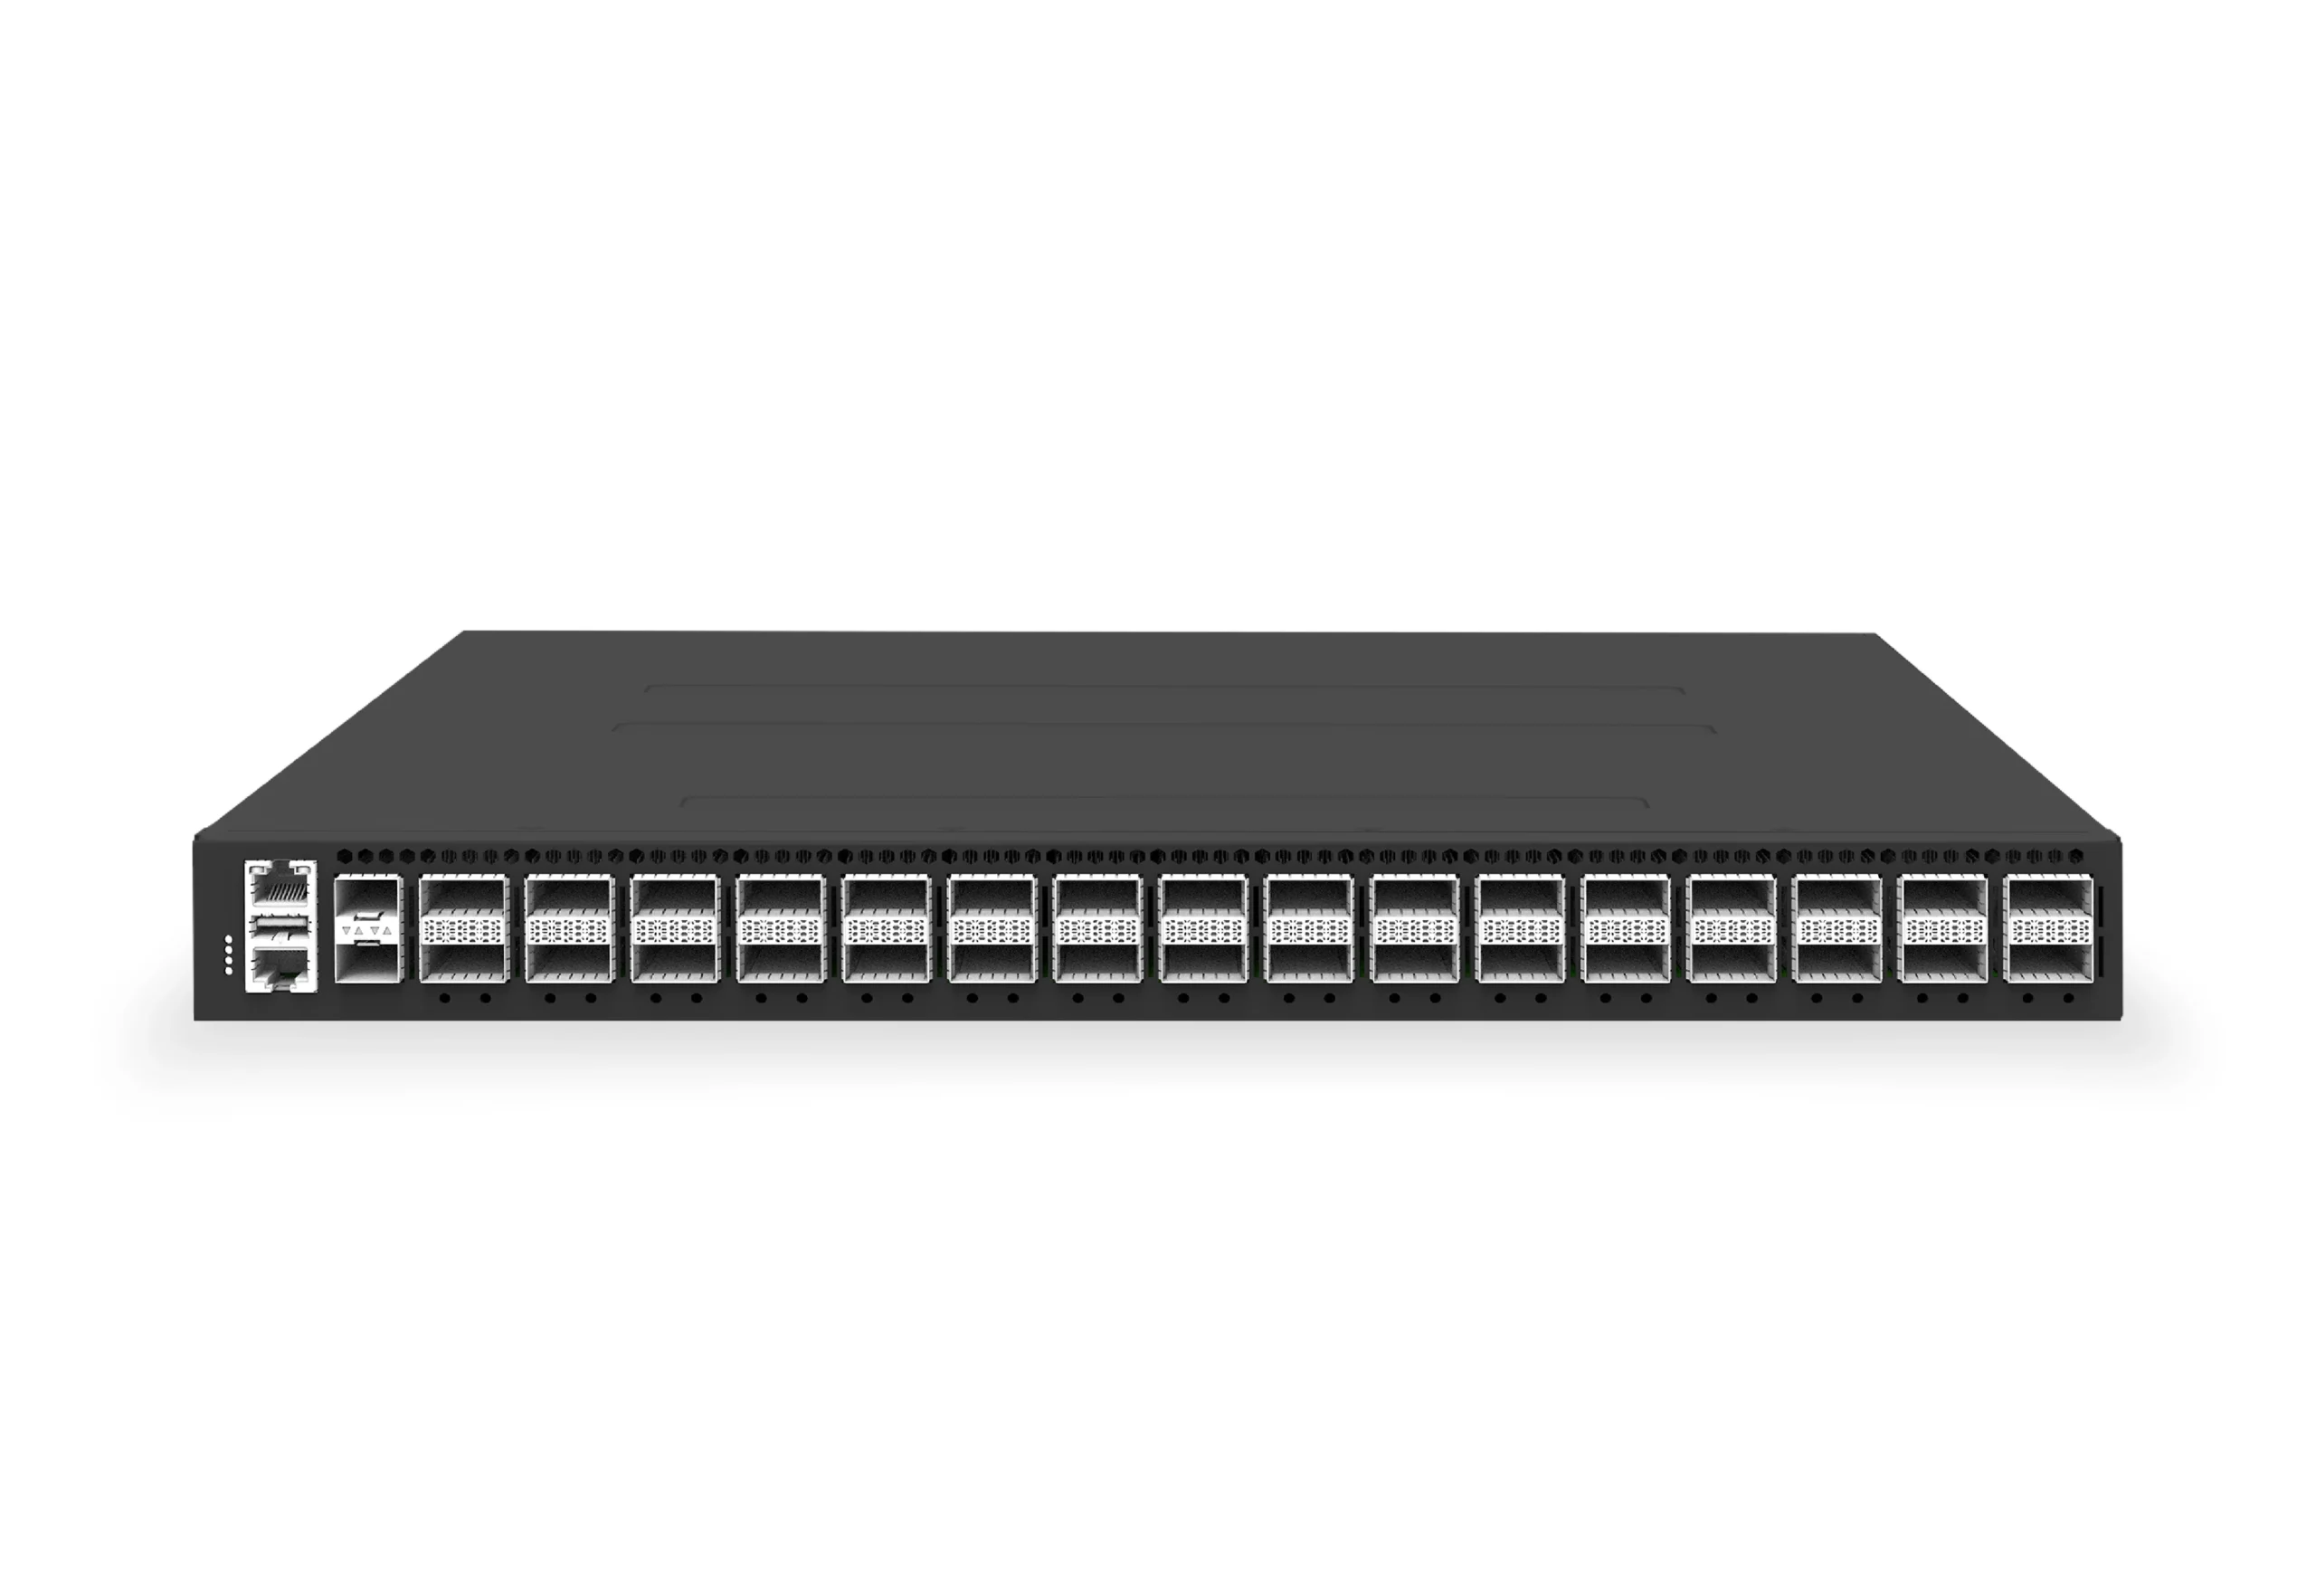
32-port 400G spine/core switch for high-capacity data center fabrics and AI-ready backbones.
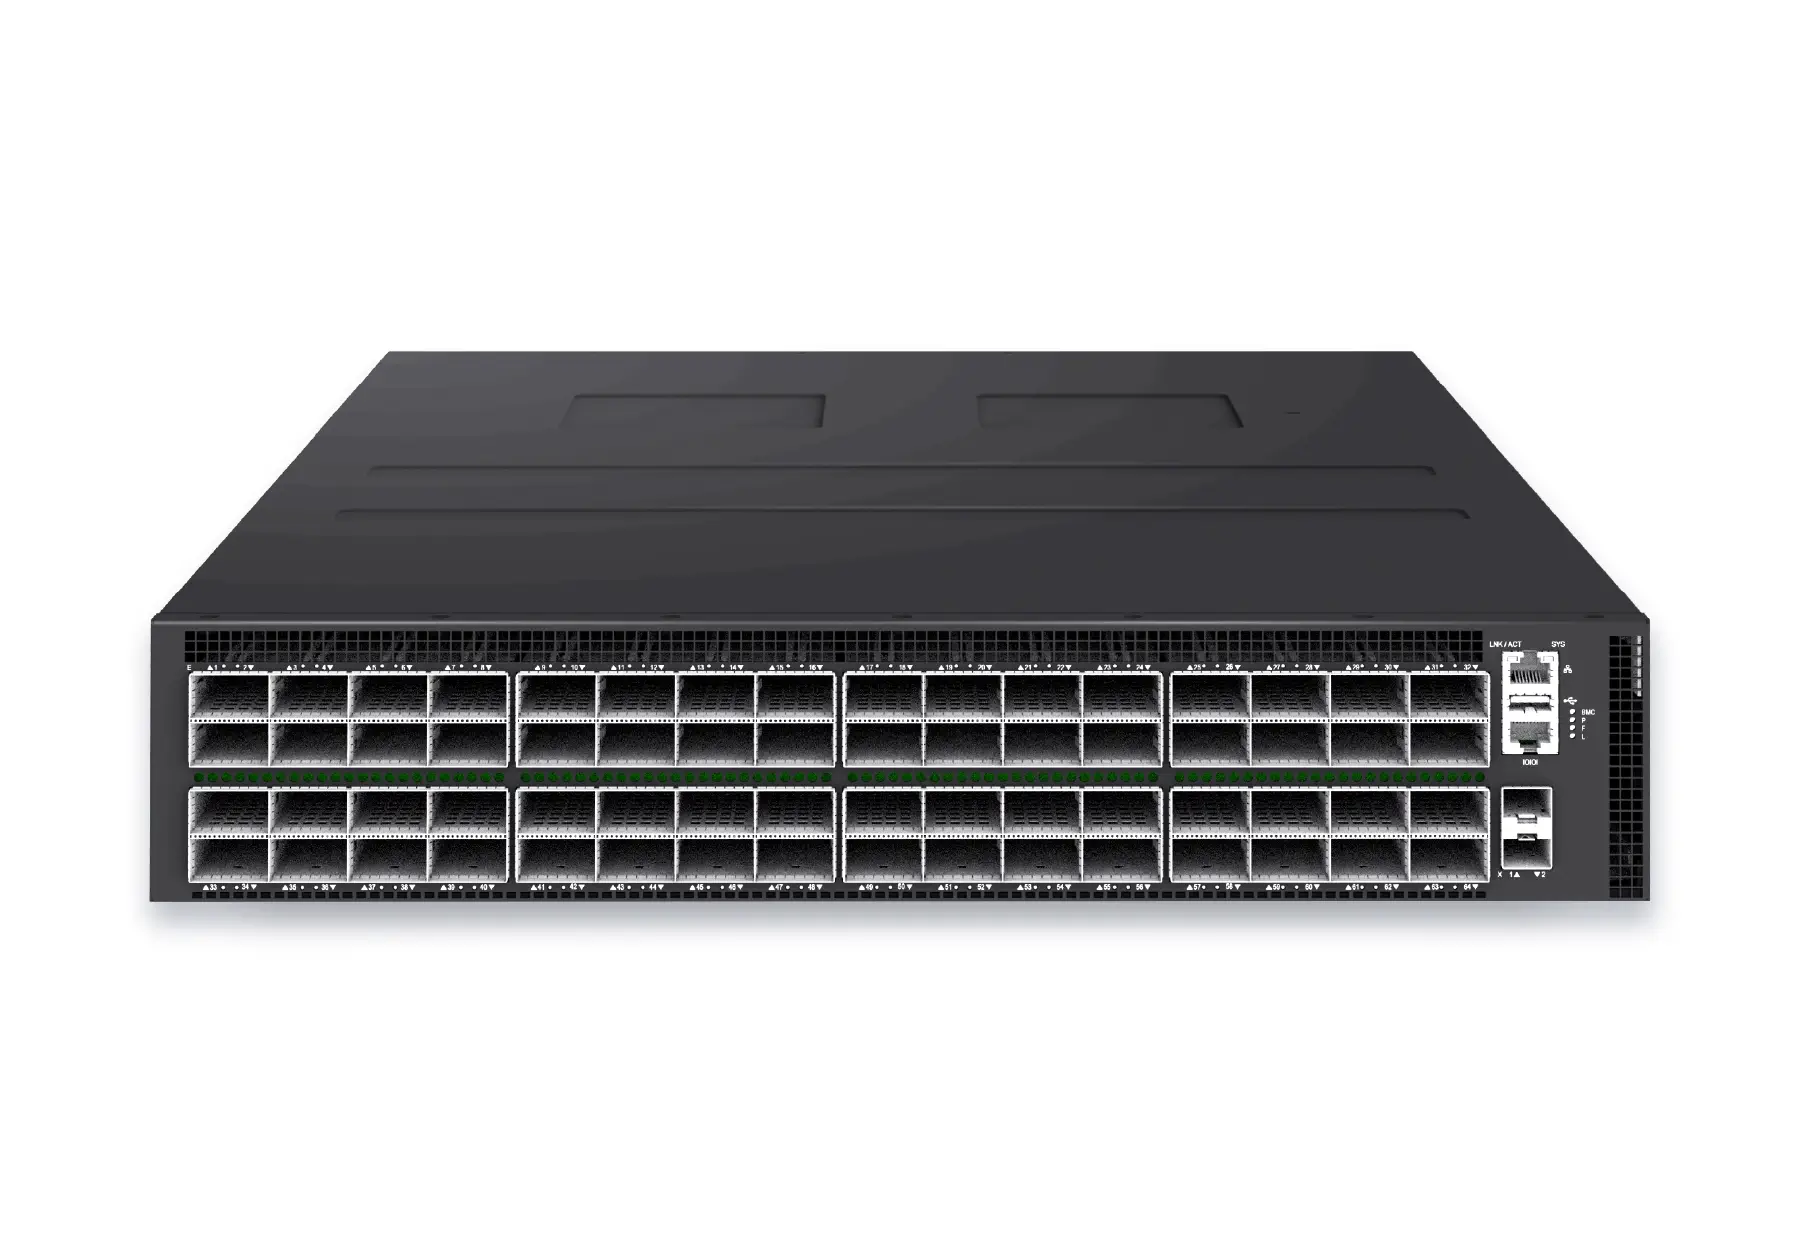
64-port 800G AI fabric switch for large-scale GPU clusters, HPC backbones, and ultra-high-throughput data center networks.
Use the related products below to continue comparing platforms, or open a conversation if you need help mapping the solution to your environment.