Australian-made deployment scope
Architecture review, solution configuration, validation planning, documentation, and commercial accountability are handled in Australia.
Data Center Solution
Follow traffic quality hop by hop through the fabric.
IPTPath telemetry is a path-oriented INT technique for monitoring quality across an AI or data center fabric. It follows selected traffic through ingress, transit, and egress nodes, then exports path information to a collector for analysis.
The goal is not just to know that a fabric is busy. The goal is to know which path, node, queue, or link is creating latency, loss risk, or unstable behavior.
| Dimension | BDC | HDC | IPTPath |
|---|---|---|---|
| Main trigger | Drop or buffer overflow. | Forwarding delay threshold. | Path telemetry selection or sampling. |
| Main signal | Queue occupancy and drop context. | Delay and queue context. | Per-hop path quality and queue/delay metrics. |
| Recommended use | Loss diagnosis. | Latency diagnosis. | End-to-end path monitoring and localization. |
An IPTPath deployment defines a telemetry domain. Switches in that domain take different roles depending on where the monitored traffic enters, travels, and exits.
| Role | Responsibility | Example |
|---|---|---|
| Ingress node | Identifies selected traffic and starts telemetry processing. | Server-facing leaf switch. |
| Transit node | Adds or updates path observations as traffic crosses the fabric. | Spine or intermediate leaf. |
| Egress node | Finalizes telemetry information and sends records to collector. | Destination leaf or boundary switch. |
| Collector | Stores, correlates, and presents telemetry data. | Operations platform or telemetry pipeline. |
Selected production flow
      |
      v
Ingress xSONiC switch marks or samples the flow
      |
      v
Transit switches add path and queue observations
      |
      v
Egress switch exports telemetry record
      |
      v
Collector builds path-quality view| Metric | Why It Matters | Operator Question |
|---|---|---|
| Per-hop forwarding delay | Reveals where packets are waiting. | Which switch or queue is causing latency? |
| Queue depth | Indicates congestion pressure. | Is a lossless class close to pause or overflow? |
| Path identity | Shows the route traffic actually took. | Did traffic follow the intended ECMP path? |
| Sampling rate | Controls data volume and visibility. | Are we seeing enough without overwhelming collectors? |
IPTPath telemetry fits xSONiC AI and data center fabrics where operators need more than device-level health. It is especially useful for large 400G and 800G fabrics where many equal-cost paths exist and path-level visibility is required to localize performance problems.
IPT and path telemetry should be accepted by troubleshooting speed. Run 3 path changes, one congested queue, and one failed uplink while recording path ID, hop sequence, latency, queue depth, and packet drops. The evidence should show where the packet changed path and why the SLO moved.
| Check | Evidence to collect | Reject condition |
|---|---|---|
| Path localization | Hop sequence, path ID, ingress/egress port, and timestamp data. | The team cannot identify the failing hop from telemetry alone. |
| Correlation | Interface counters, queue telemetry, application latency, and alert time. | Telemetry and application timing cannot be aligned. |
| Collector readiness | Sampling rate, storage rate, query latency, and retention policy. | The collector drops data during the event it was meant to diagnose. |
Flow monitoring can tell operators who talked to whom and how much traffic was sent. IPTPath is useful when the question is where the traffic experienced queueing, delay, path change, or loss risk. It is a path-quality tool, not only a traffic-accounting tool.
Use 3 representative paths, at least 2 packet sizes, one planned ECMP path change, and one congestion event. The pilot should prove that the collector can store, query, and replay the hop sequence quickly enough for an incident review.
Australian-Made Deployment Scope
Architecture review, solution configuration, validation planning, documentation, and commercial accountability are handled in Australia.
Switching, optics, storage, server, and packet visibility components are selected against port speed, OS, telemetry, power, and deployment requirements.
The bill of materials is checked against RFP requirements, rollback path, optics compatibility, support model, and export screening before order release.
xSONiC supports international buyers through Australian project ownership, acceptance evidence, documentation, and post-delivery escalation.
Related Products
Use these related platforms as a starting point for sizing, comparison, and follow-up discussion.
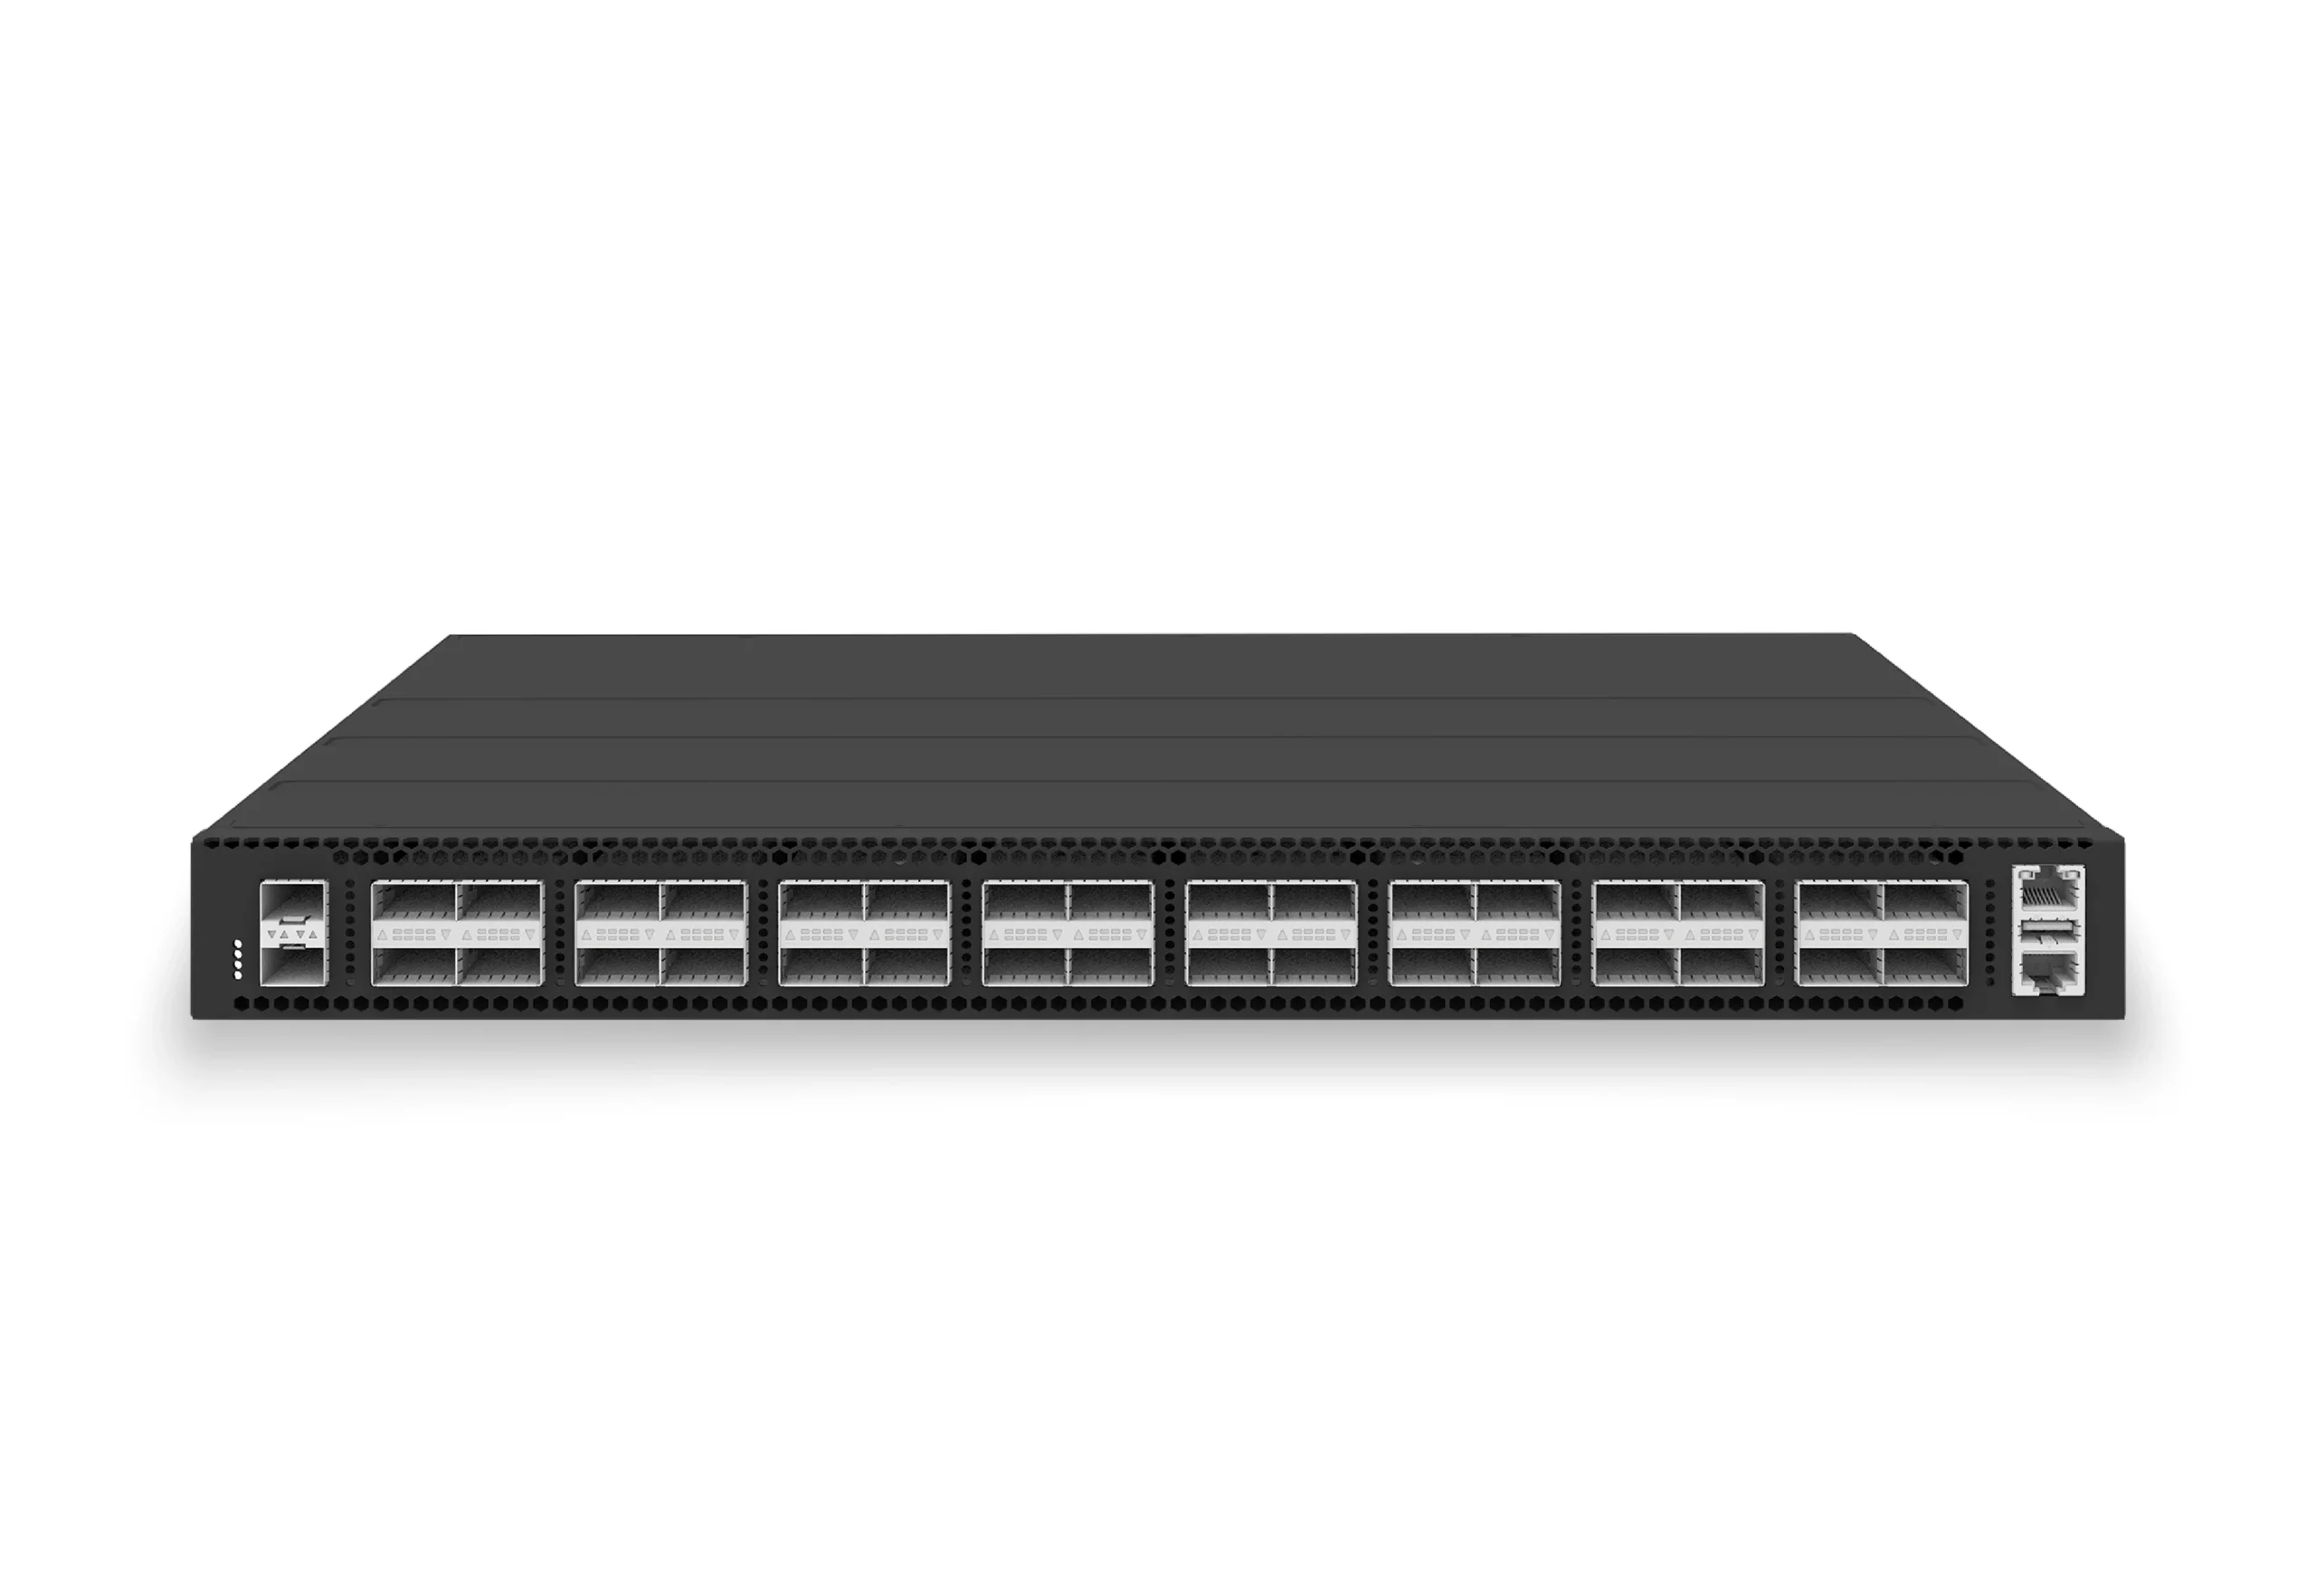
32-port 100G leaf/spine switch for VXLAN fabrics, RoCE-ready workloads, and tenant-scale routing.
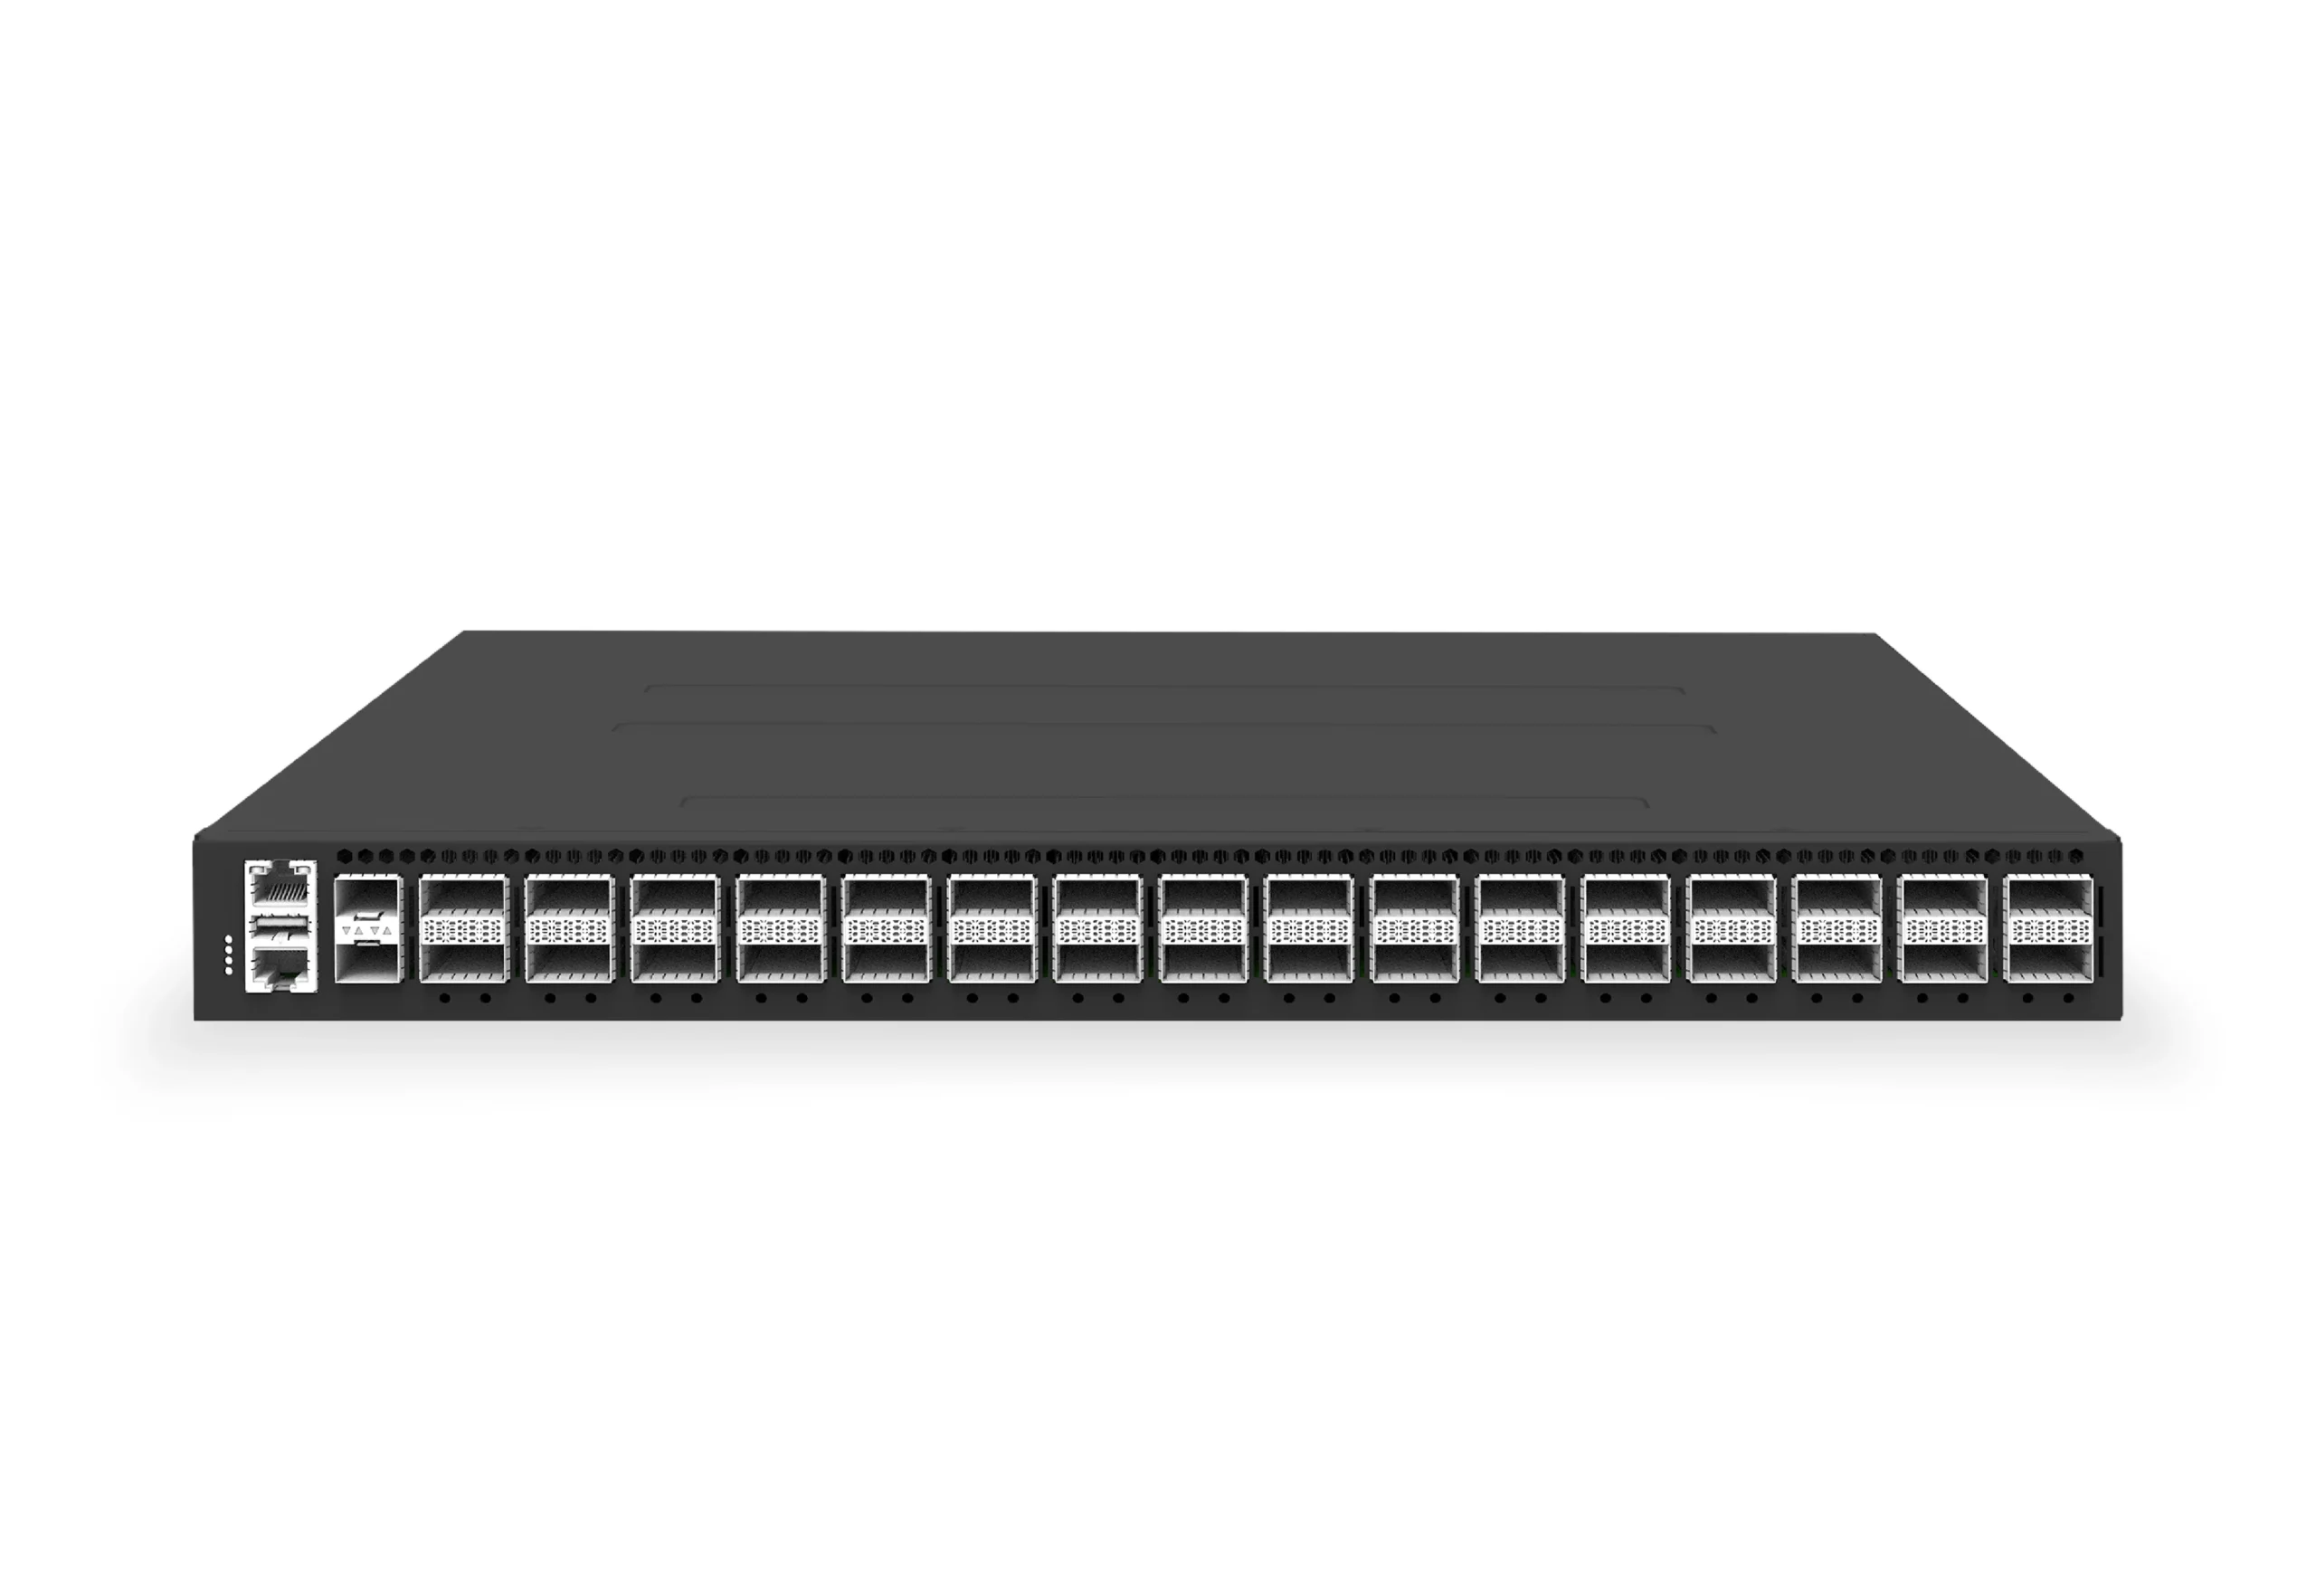
32-port 400G spine/core switch for high-capacity data center fabrics and AI-ready backbones.
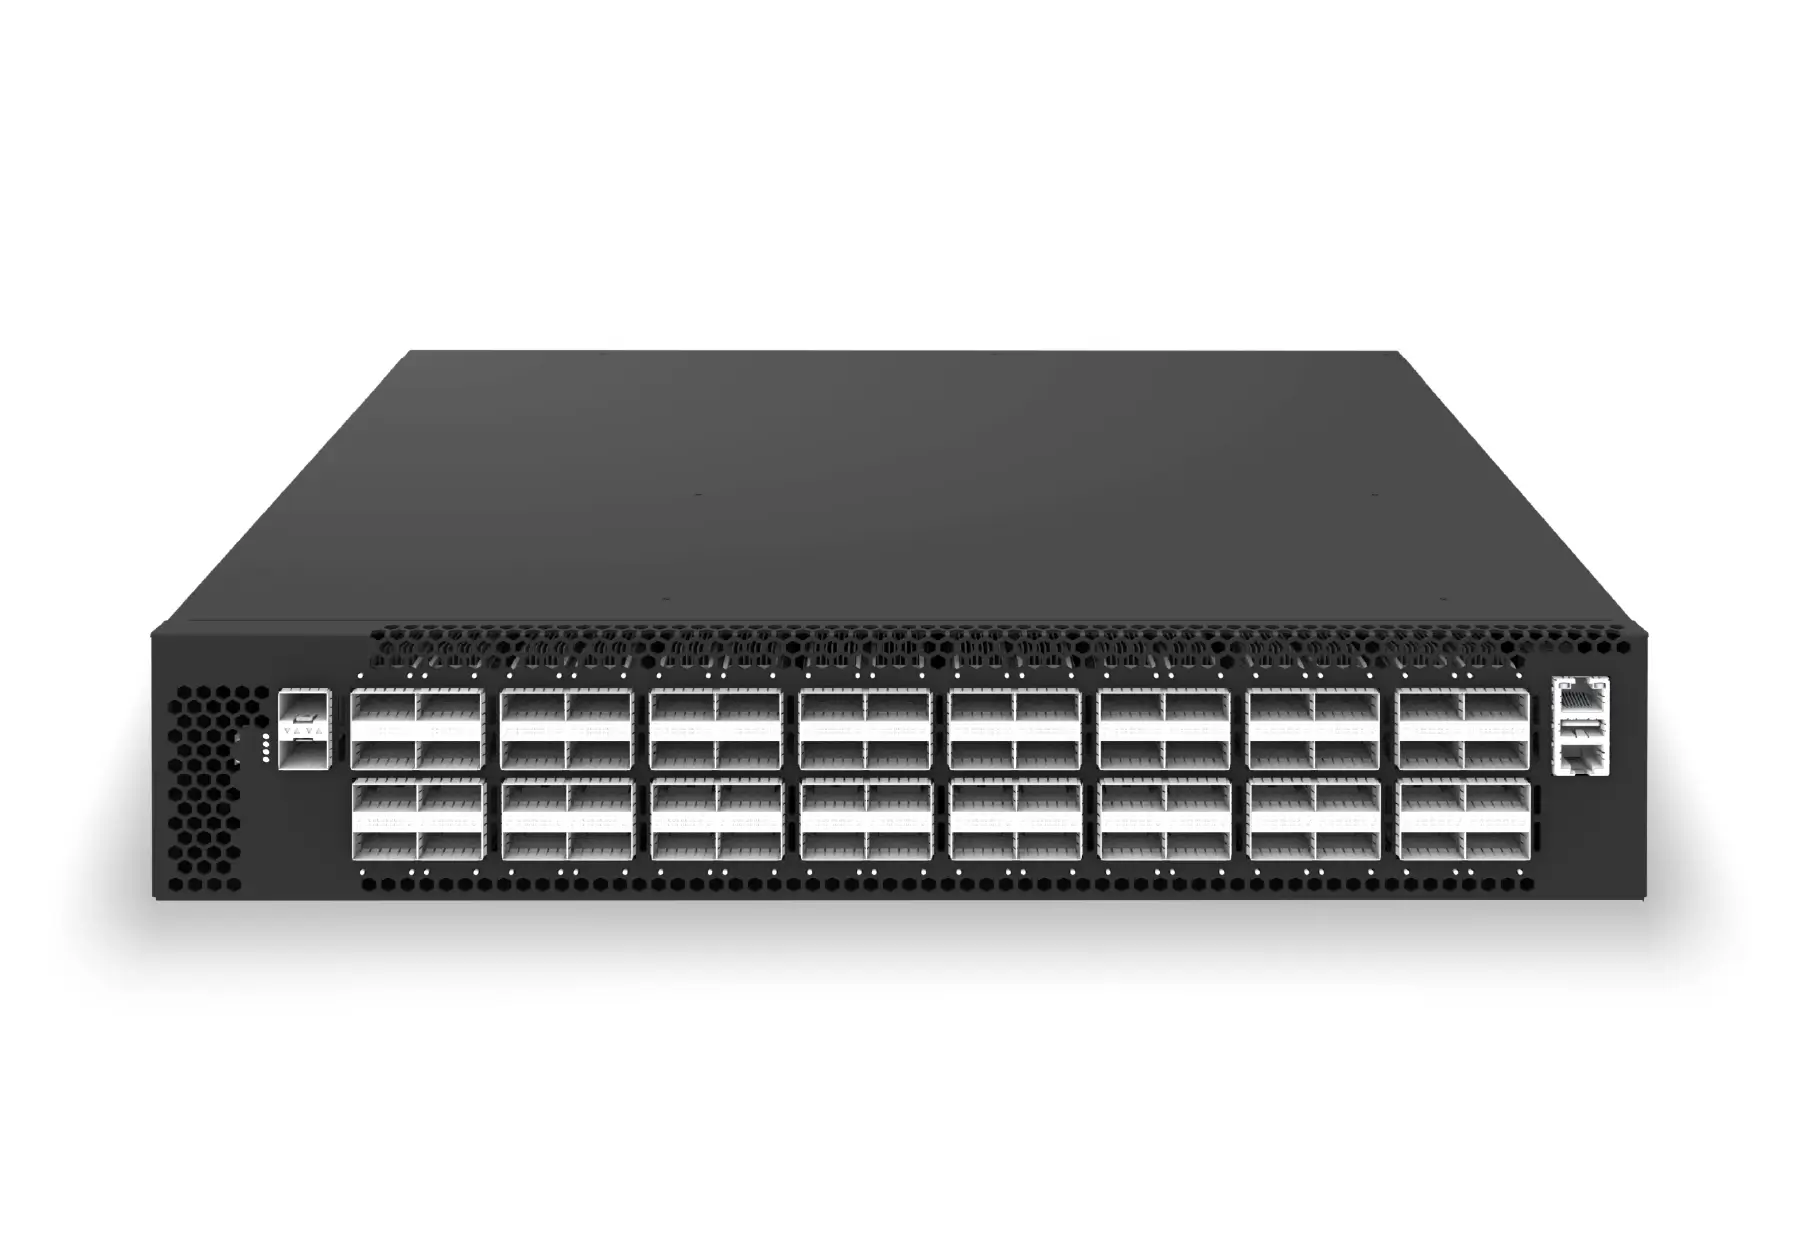
64-port 200G leaf/spine switch for high-bandwidth storage, compute, and scale-out data center fabrics.
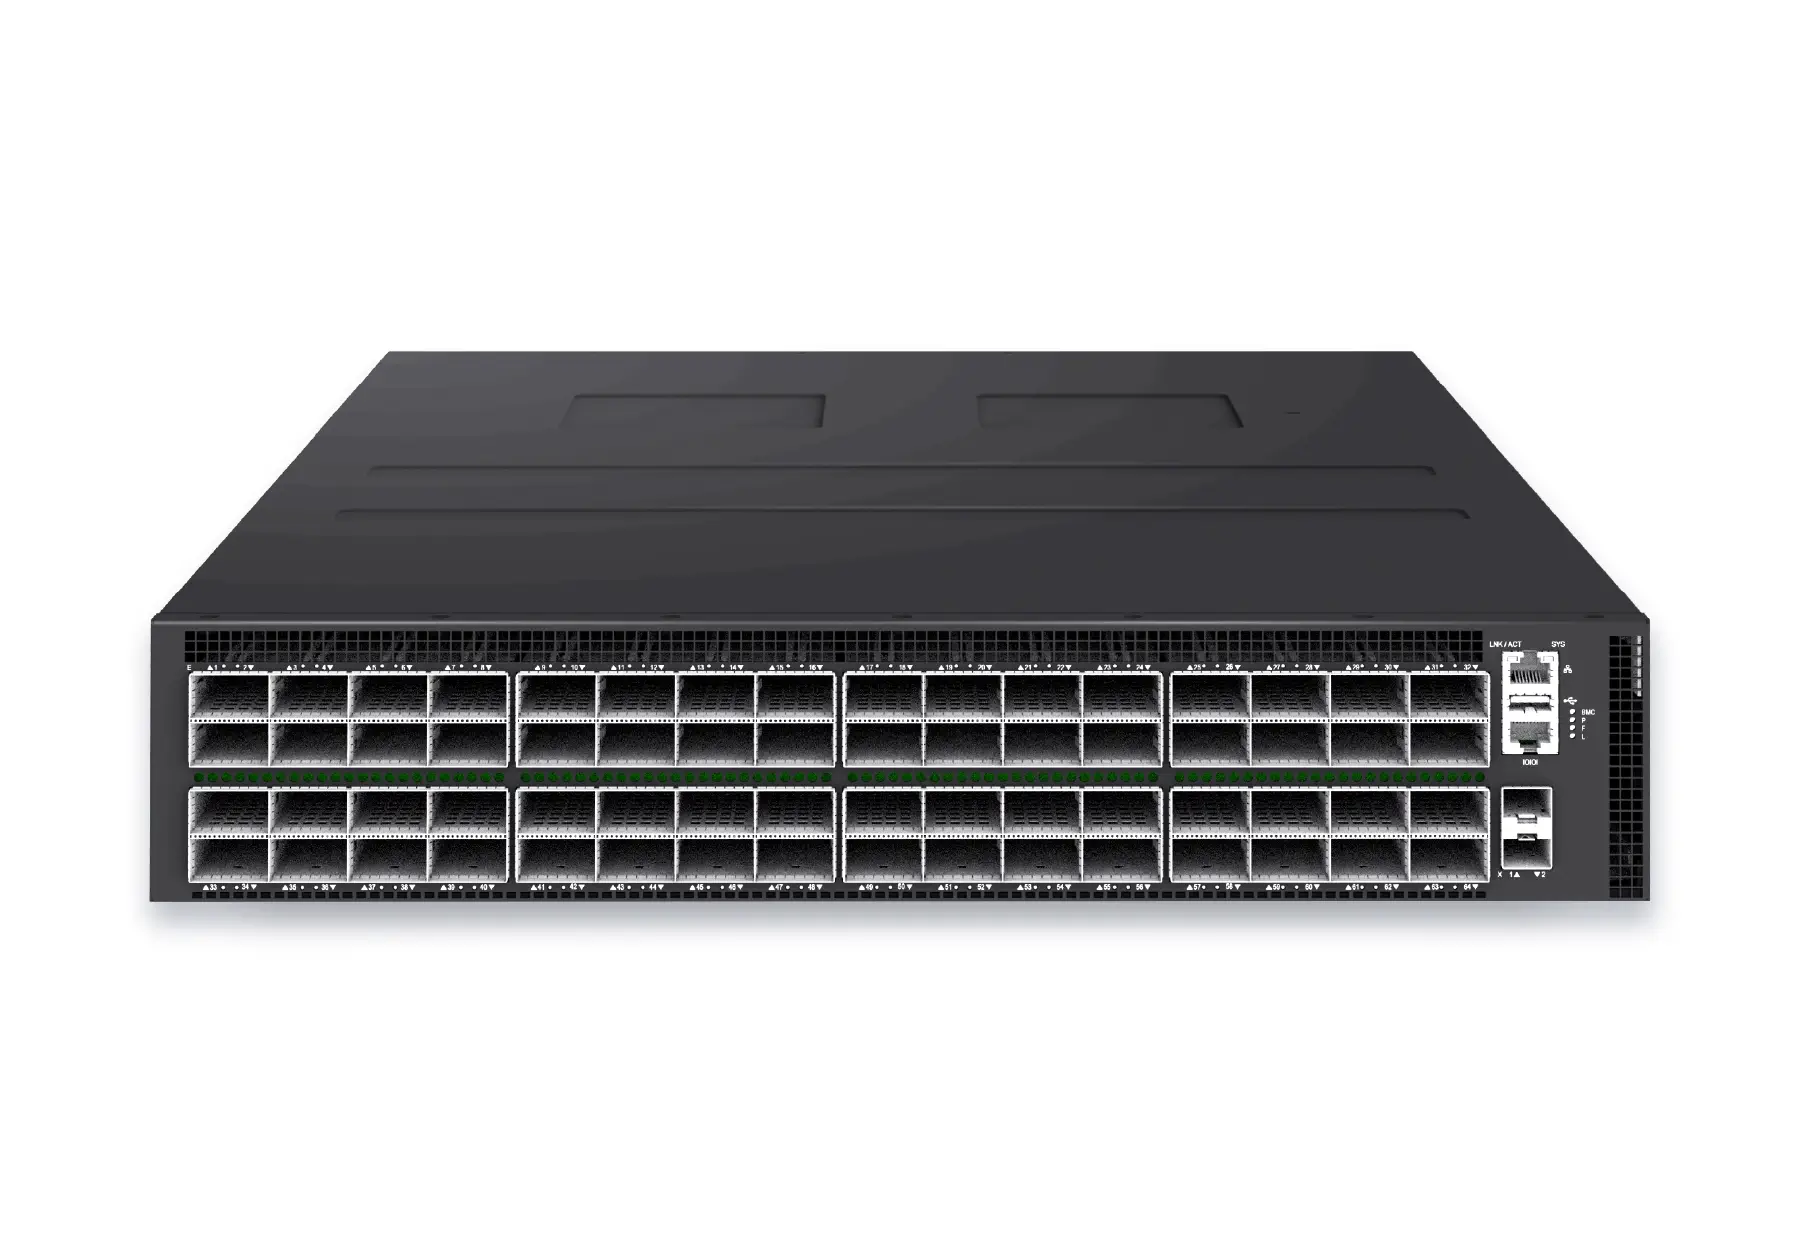
64-port 800G AI fabric switch for large-scale GPU clusters, HPC backbones, and ultra-high-throughput data center networks.
Use the related products below to continue comparing platforms, or open a conversation if you need help mapping the solution to your environment.