In brief
Engineering guide for network telemetry and automation covering gNMI, NETCONF/YANG, observability, rollback, and operating evidence.
Key takeaways
- When your network operating system is proprietary, telemetry is often a licensed add-on.
- SONiC (Software for Open Networking in the Cloud) takes a different architectural approach.
- For Australian enterprise and data center teams evaluating open networking as part of an AI fabric refresh or campus modernization project, this matters for three reasons:
Why telemetry automation matters more in open networking
When your network operating system is proprietary, telemetry is often a licensed add-on. You pay extra for streaming data. You wait for the vendor to expose the counters you actually need. You rebuild dashboards every time the hardware generation changes.
SONiC (Software for Open Networking in the Cloud) takes a different architectural approach. Because every SONiC switch runs on a containerized Linux stack with a shared Redis-based state database, the telemetry data plane is inherently open and programmable from day one. There is no separate telemetry license to unlock. The counters, interface statistics, BGP neighbor states, and buffer occupancy data that operations teams need are accessible through standard Linux tools, gNMI, gRPC streaming telemetry, and the SONiC command-line interface.
For Australian enterprise and data center teams evaluating open networking as part of an AI fabric refresh or campus modernization project, this matters for three reasons:
-
Faster root-cause isolation. When every switch exposes the same telemetry schema across multiple hardware vendors, your automation scripts do not need to change when you introduce a new ASIC or platform.
-
Lower integration cost. Open telemetry interfaces plug directly into Prometheus, Grafana, Telegraf, and other tools your operations team already runs. No vendor-specific collectors required.
-
No telemetry lock-in. If you decide to change your monitoring stack, the SONiC data model follows you. You are not starting over.
This article walks through the key telemetry capabilities SONiC provides, how they map to real operational workflows, and what xSONiC product families deliver in practice.
SONiC architecture: why telemetry is a first-class citizen
SONiC is built on a modular, container-based architecture where each network function runs in its own Docker container. The SONiC project documentation describes this as providing better fault isolation, easier debugging, simplified upgrades, and enhanced scalability. That container design also has a direct impact on telemetry.
Because SONiC uses a central Redis-based state database (known as APPL_DB, CONFIG_DB, and STATE_DB) to pass information between containers, every subsystem writes its operational state into a structured, queryable store. The BGP container writes neighbor state. The interface container writes link status and counter data. The buffer manager writes queue occupancy. This means that a monitoring agent does not need to poll individual daemon sockets or parse unstructured log files. It can subscribe to state-database changes or query the database directly.
This is a fundamentally different model from many proprietary NOS stacks where telemetry is a bolt-on subsystem with its own data format and its own access controls.
Streaming telemetry with gNMI and gRPC
SONiC supports streaming telemetry through the OpenConfig data model and gNMI (gRPC Network Management Interface). In practice, this means:
-
Push-based data delivery. Instead of polling SNMP every 60 seconds and hoping you catch a microburst, SONiC switches can push interface counters, queue depths, and buffer statistics at configurable intervals (for example, every 10 seconds) directly to your telemetry collector.
-
Structured YANG-modeled data. The data arrives in structured key-value pairs based on OpenConfig YANG models, which means your Grafana dashboards or custom Python scripts can parse it without vendor-specific parsing logic.
-
Subscription-based access. You configure a gNMI subscription on the switch specifying which paths you want (for example,
/interfaces/interface/state/counters) and the push interval. The switch streams data to your collector endpoint over gRPC.
For teams running AI fabric deployments where RoCE v2 traffic is sensitive to buffer congestion and microbursts, the ability to stream queue-depth and pause-frame counters at sub-10-second intervals is not a nice-to-have. It is the difference between catching a congestion event in real time and finding out from a dropped-job alert an hour later.
The SONiC CLI and show commands
For day-two troubleshooting, SONiC provides a rich set of show commands that query the state database and present human-readable output. Common operational commands include:
| Command | Purpose |
|---|---|
show system status | Overall system health |
show interfaces status | Link state, speed, MTU for all ports |
show ip route | Routing table |
show bgp summary | BGP neighbor state and prefixes received |
show queue counters | Per-queue packet and byte counts |
show priority-group headroom | Buffer headroom for lossless traffic |
These commands are useful for ad hoc troubleshooting, but the real operational value comes when you wrap them in automation. Because SONiC runs on standard Linux, you can use Ansible, Python scripts, or Nornir to run show commands across hundreds of switches, parse the JSON output, and flag anomalies automatically.
INT and IPTPath telemetry for fabric-level visibility
SONiC-based switches that support In-band Network Telemetry (INT) can embed metadata directly into the data plane as packets traverse the fabric. Each switch in the path appends its switch ID, ingress and egress port, queue depth, and latency to the packet header. At the egress point, a telemetry collector or packet broker extracts the metadata and builds a hop-by-hop view of the traffic path.
This is particularly valuable for:
-
AI/ML training clusters where a single slow path in a RoCE v2 backend fabric can stall an entire distributed training job.
-
Multi-tenant data centers where you need per-tenant traffic visibility without running separate monitoring taps at every hop.
-
Troubleshooting intermittent congestion where standard interface counters show no drops but end-to-end latency is degraded.
xSONiC’s INT Telemetry and IPTPath Telemetry solution guides cover the configuration and deployment specifics for xSONiC data center AI switches.
SNMP and legacy integration
Not every monitoring stack has moved to gNMI. Many Australian enterprises still rely on SNMP-based tools like SolarWinds, PRTG, or Nagios for baseline monitoring. SONiC supports SNMP v2c and v3 through a containerized SNMP agent, so you can continue to poll standard MIBs (IF-MIB, BRIDGE-MIB, BGP4-MIB) while you transition to streaming telemetry.
The recommended migration path is:
- Keep SNMP polling running for existing dashboards and alerting.
- Deploy a gNMI or gRPC collector (for example, Telegraf with the gNMI input plugin) in parallel.
- Migrate dashboards to the streaming data source over 2-4 weeks.
- Reduce SNMP poll frequency once streaming telemetry is validated.
- Decommission SNMP polling when the team is confident in the new pipeline.
This dual-stack approach avoids a big-bang cutover and lets your operations team build familiarity with the new data model at their own pace.
Programmable telemetry with Redis and the SONiC management framework
Because SONiC’s state database is Redis, operations teams with development capability can build custom telemetry agents that subscribe to specific keys or key patterns. For example:
- Subscribe to
PORT_TABLE:*changes to get real-time link flaps. - Subscribe to
BGP_NEIGHBOR_TABLE:*to detect BGP session resets within seconds. - Query
QUEUE_STAT_TABLEto build per-tenant bandwidth reports.
The SONiC management framework also supports NETCONF and RESTCONF interfaces (as described in the NETCONF solution guide), which means you can integrate SONiC telemetry with broader network automation platforms like Ansible Tower, StackStorm, or custom CI/CD pipelines.
For teams deploying the xSONiC AIDC Controller, these programmable interfaces enable centralized telemetry aggregation across a multi-vendor SONiC fabric.
Packet broker integration for security and compliance
In environments where traffic must be mirrored to security tools, compliance monitors, or deep-packet-inspection appliances, xSONiC network packet brokers complement SONiC switch telemetry by aggregating, filtering, and replicating traffic flows to the right tool at the right time.
The operational workflow looks like this:
- SONiC switches stream interface and queue telemetry to your monitoring stack.
- When an anomaly is detected (for example, a spike in retransmits on a specific VLAN), an automation script triggers a packet broker rule to mirror that traffic to a forensic capture appliance.
- The capture appliance records the traffic for analysis.
- After the investigation, the mirror rule is removed.
This closed-loop approach reduces the cost of always-on traffic mirroring while preserving the ability to capture traffic on demand when telemetry flags a problem.
Practical checklist: evaluating SONiC telemetry for your next refresh
If you are considering SONiC-based switching for your next campus refresh or data center build, use this checklist to evaluate telemetry readiness:
- Does the switch platform support gNMI streaming telemetry with OpenConfig models?
- Is the SONiC image version recent enough to include the telemetry subsystems you need?
- Does your monitoring stack (Prometheus, Grafana, Telegraf, or commercial) support gNMI or gRPC input?
- Have you tested INT or IPTPath telemetry on your specific ASIC and SONiC version?
- Is SNMP still required for legacy tooling, and is a dual-stack migration plan in place?
- Can your team write or adapt Ansible/Python automation for show-command parsing?
- Is your packet broker capable of receiving trigger signals from your telemetry pipeline?
What this means for Australian enterprise buyers
The SONiC telemetry model is one of the strongest operational arguments for open networking. It removes the dependency on a single vendor’s monitoring and management stack. It gives your operations team direct access to the data they need in the format they prefer. And it integrates with the Linux-based automation tools that most enterprise network teams are already adopting.
For Australian data center and campus teams, this translates to:
-
Lower operational risk. Telemetry data is not locked behind a vendor portal or license tier.
-
Faster troubleshooting. Streaming telemetry and programmatic access to the state database reduce MTTR compared to SNMP-only environments.
-
Future-proofing. As your monitoring stack evolves, the SONiC telemetry interfaces remain stable and standards-based.
If you want to discuss how xSONiC data center AI switches, bare-metal platforms, or packet brokers can fit into your telemetry and monitoring strategy, contact the xSONiC team.
Engineering Evidence Floor
For telemetry and automation topics, accept the design only when state, change, and incident evidence are connected. The evidence package should include gNMI or NETCONF/YANG support, telemetry cadence, collector location, alert thresholds, config source of truth, rollback, packet visibility, retention, and escalation ownership. A practical pilot should run 24 hours of streaming telemetry, include 3 automated changes, and prove that an incident bundle can be produced within 2 hours.
| Evidence area | What to validate | Acceptance gate | Rework trigger |
|---|---|---|---|
| State export | gNMI/OpenConfig, NETCONF/YANG, counters, and optics data | 24 hours telemetry stream retained | Dashboards lose data during faults |
| Change control | Source of truth, diff, validation, and rollback | 3 automated changes pass readback | Automation pushes config without proof |
| Incident view | Alerts, logs, packet feeds, and queue/drop counters | Root cause path identified within 15 minutes | Graphs show symptoms but not cause |
| Security | Access control, retention, audit trail, and sovereignty | 30 days evidence policy documented | Telemetry path violates data handling rules |
| Support | Escalation owner, evidence bundle, patching, and RMA | P1 package ready within 2 hours | Vendor handoff lacks data |
Engineering FAQ
What should be tested before moving campus switching to SONiC or open networking? Test PoE behaviour, NAC integration, VLAN and policy design, STP or MC-LAG interaction, multicast, monitoring, upgrade rollback, and help-desk workflows. Campus readiness is an operations test, not only a forwarding test.
Where do campus refresh projects usually carry hidden risk? The risk often sits in closets: power budget, old cabling, undocumented uplinks, mixed endpoint types, voice devices, cameras, badge systems, and change windows. Those details should be inventoried before selecting switch models.
How should Australian campus teams structure a pilot? Choose one representative site or building, document endpoint classes, run PoE and failover tests, verify monitoring, train operations staff, and define rollback steps before expanding to the broader estate.
Related xSONiC Resources
Sources Reviewed
- Ethernet Network Adapters - ConnectX NICs | NVIDIA
- NVIDIA BlueField Data Processing Unit
- NVIDIA Spectrum-X Ethernet Platform
- OpenConfig gNMI Specification
- OpenConfig
- RFC 7950 - The YANG 1.1 Data Modeling Language
- RFC 6241 - Network Configuration Protocol (NETCONF)
- ACSC Essential Eight
- OAIC Notifiable Data Breaches
- APRA CPS 234 Information Security
- NETSCOUT Network Packet Definition
- Cloudflare Network Packet Definition
- SONiC Project Documentation
- Broadcom Ethernet Switching
- Marvell Switching
- NVIDIA Ethernet Switching
- Open Compute Networking
- SONiC GitHub
- SONiC Foundation
Product fit
Products referenced for evaluation
These products are referenced for evaluation context in the article. Confirm workload, port, optics, software, interoperability, and support requirements against the exact deployment before procurement.
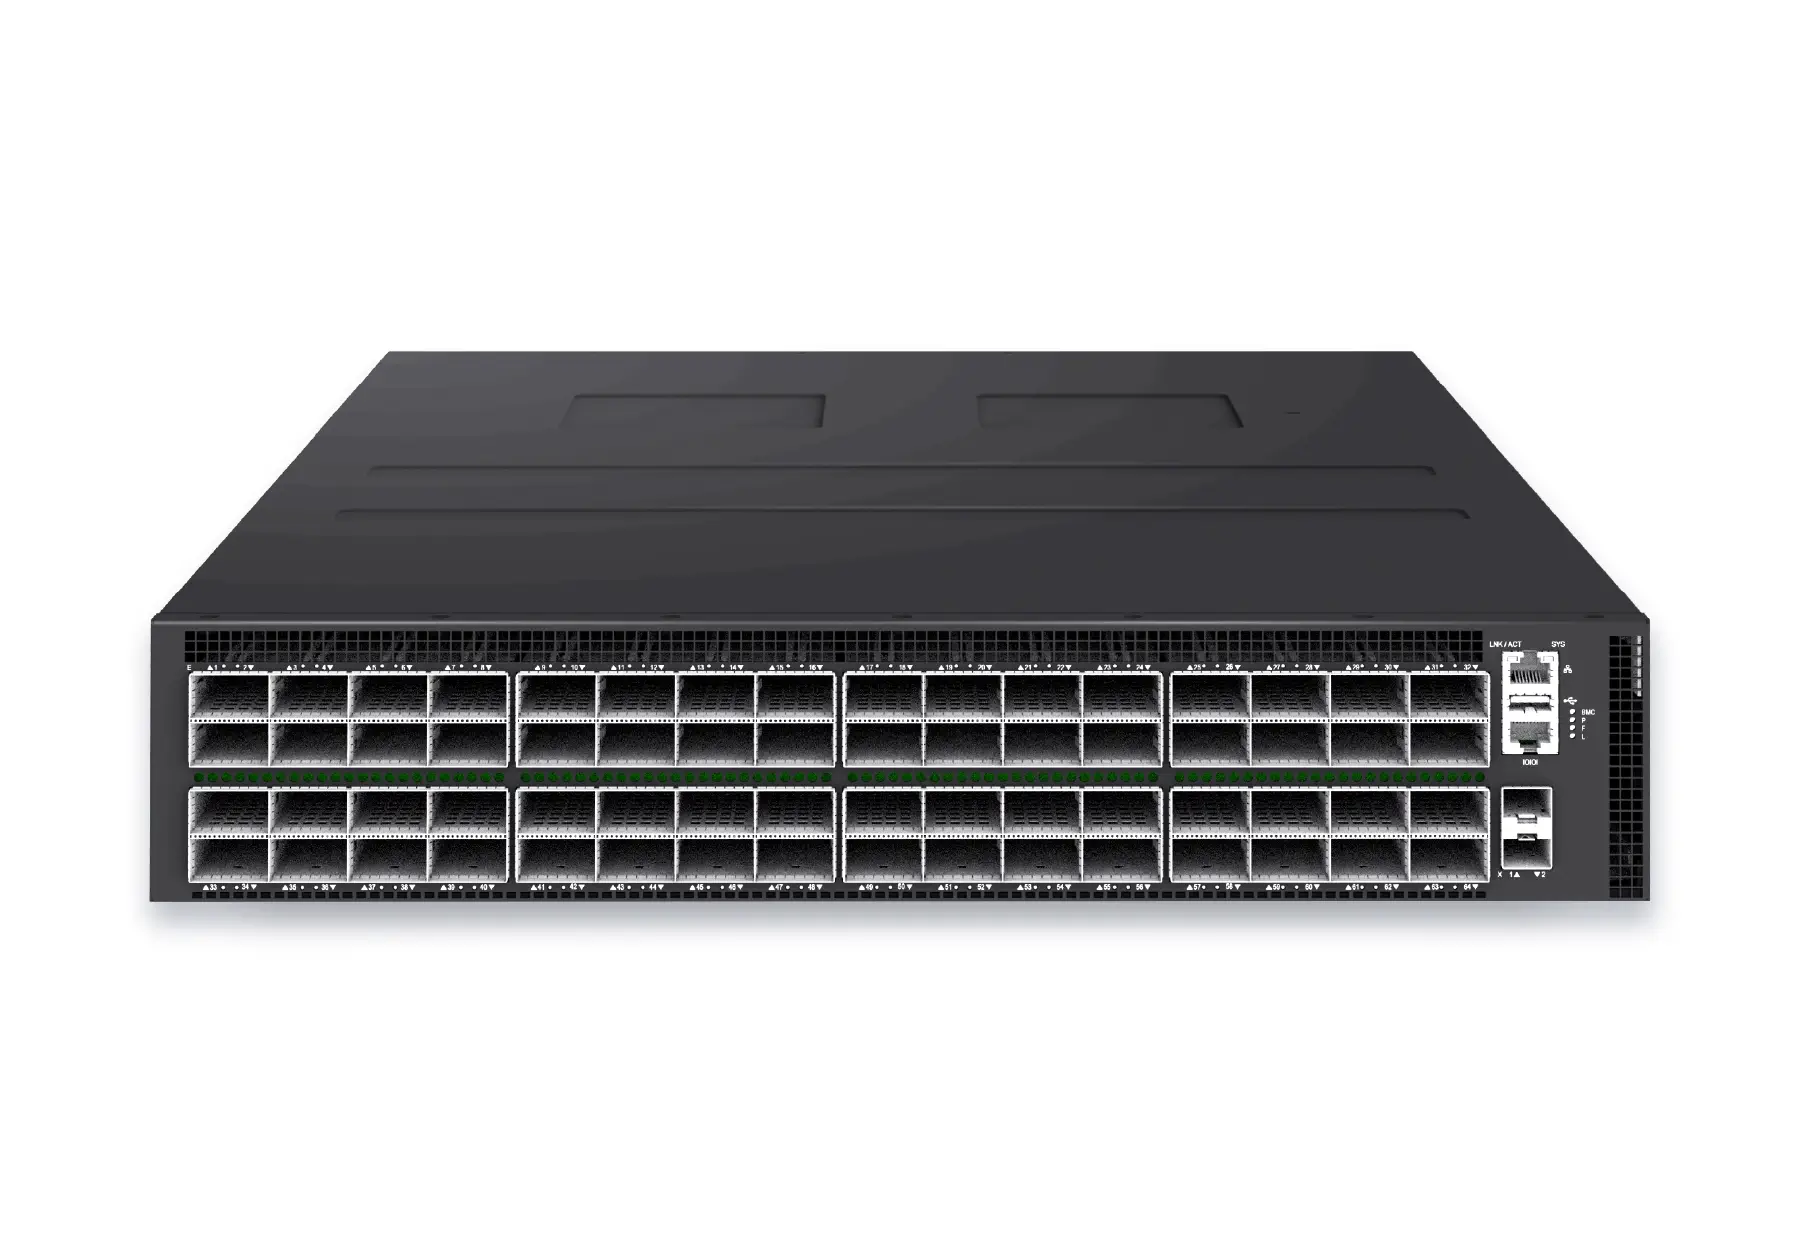 datacenter aiXS-DC-64X800-AI-G164-port 800G AI fabric switch for large-scale GPU clusters, HPC backbones, and ultra-high-throughput data center networks.View product
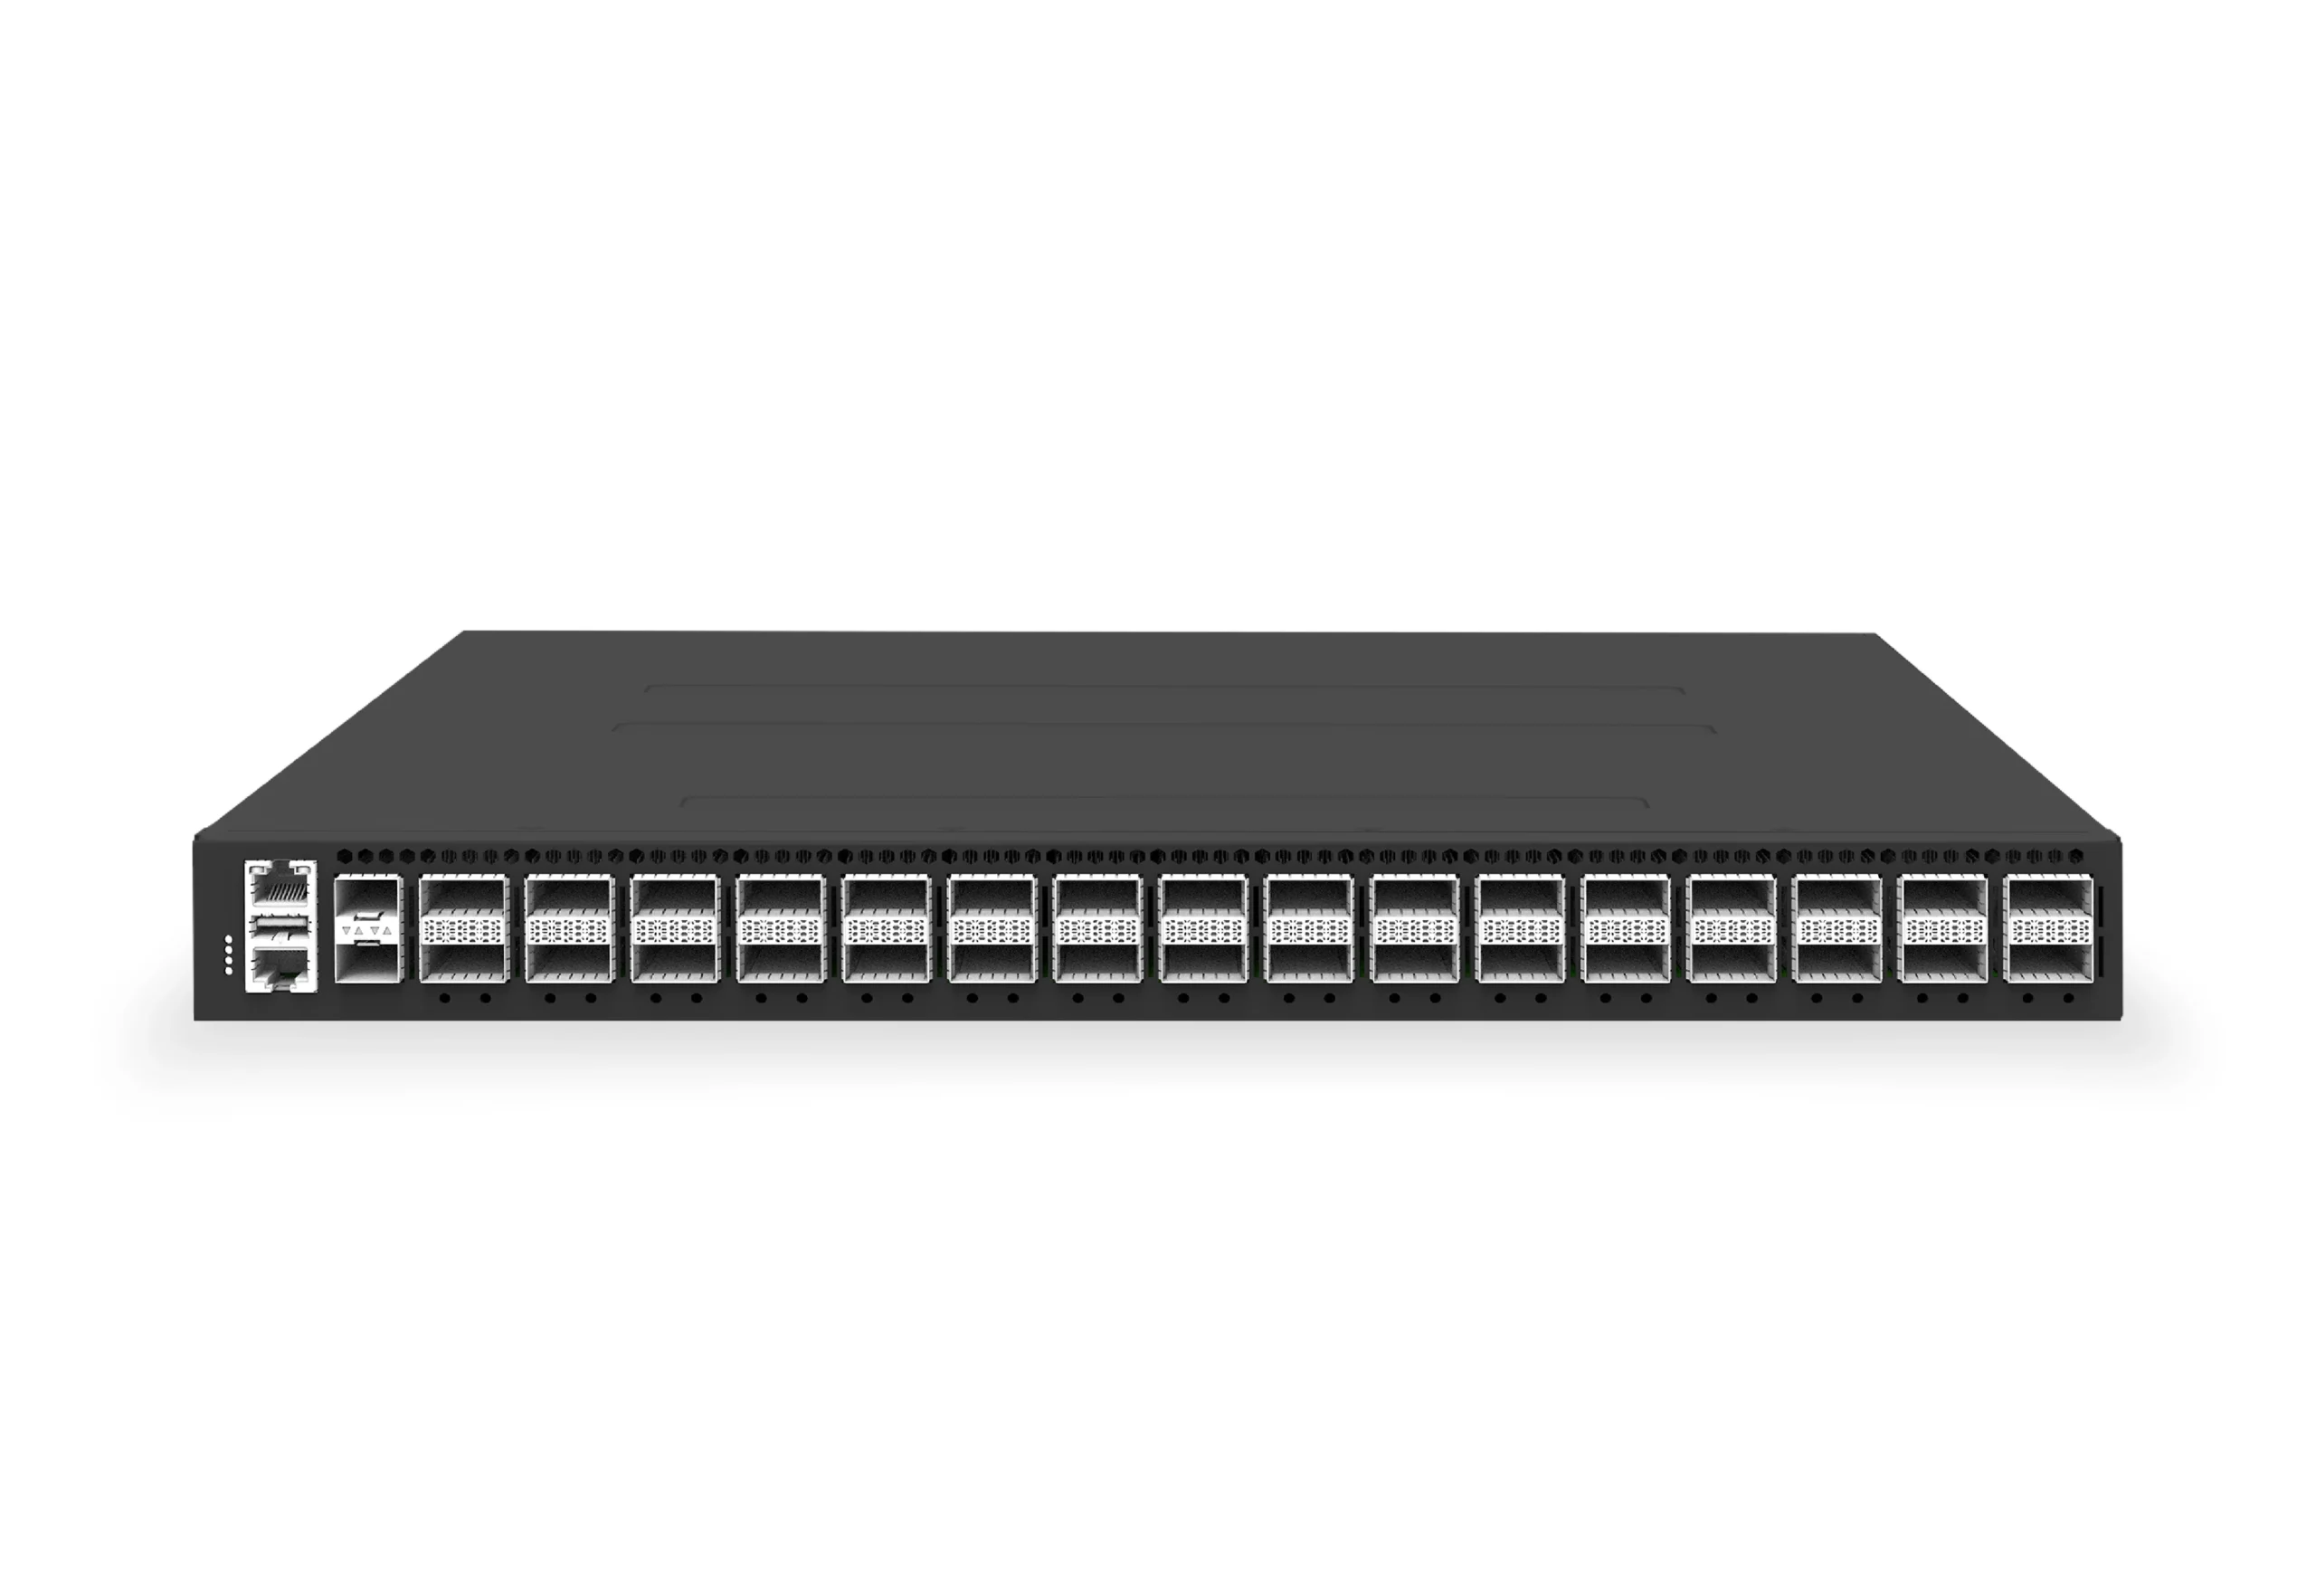 datacenter aiXS-DC-32X400-SP-G232-port 400G spine/core switch for high-capacity data center fabrics and AI-ready backbones.View product
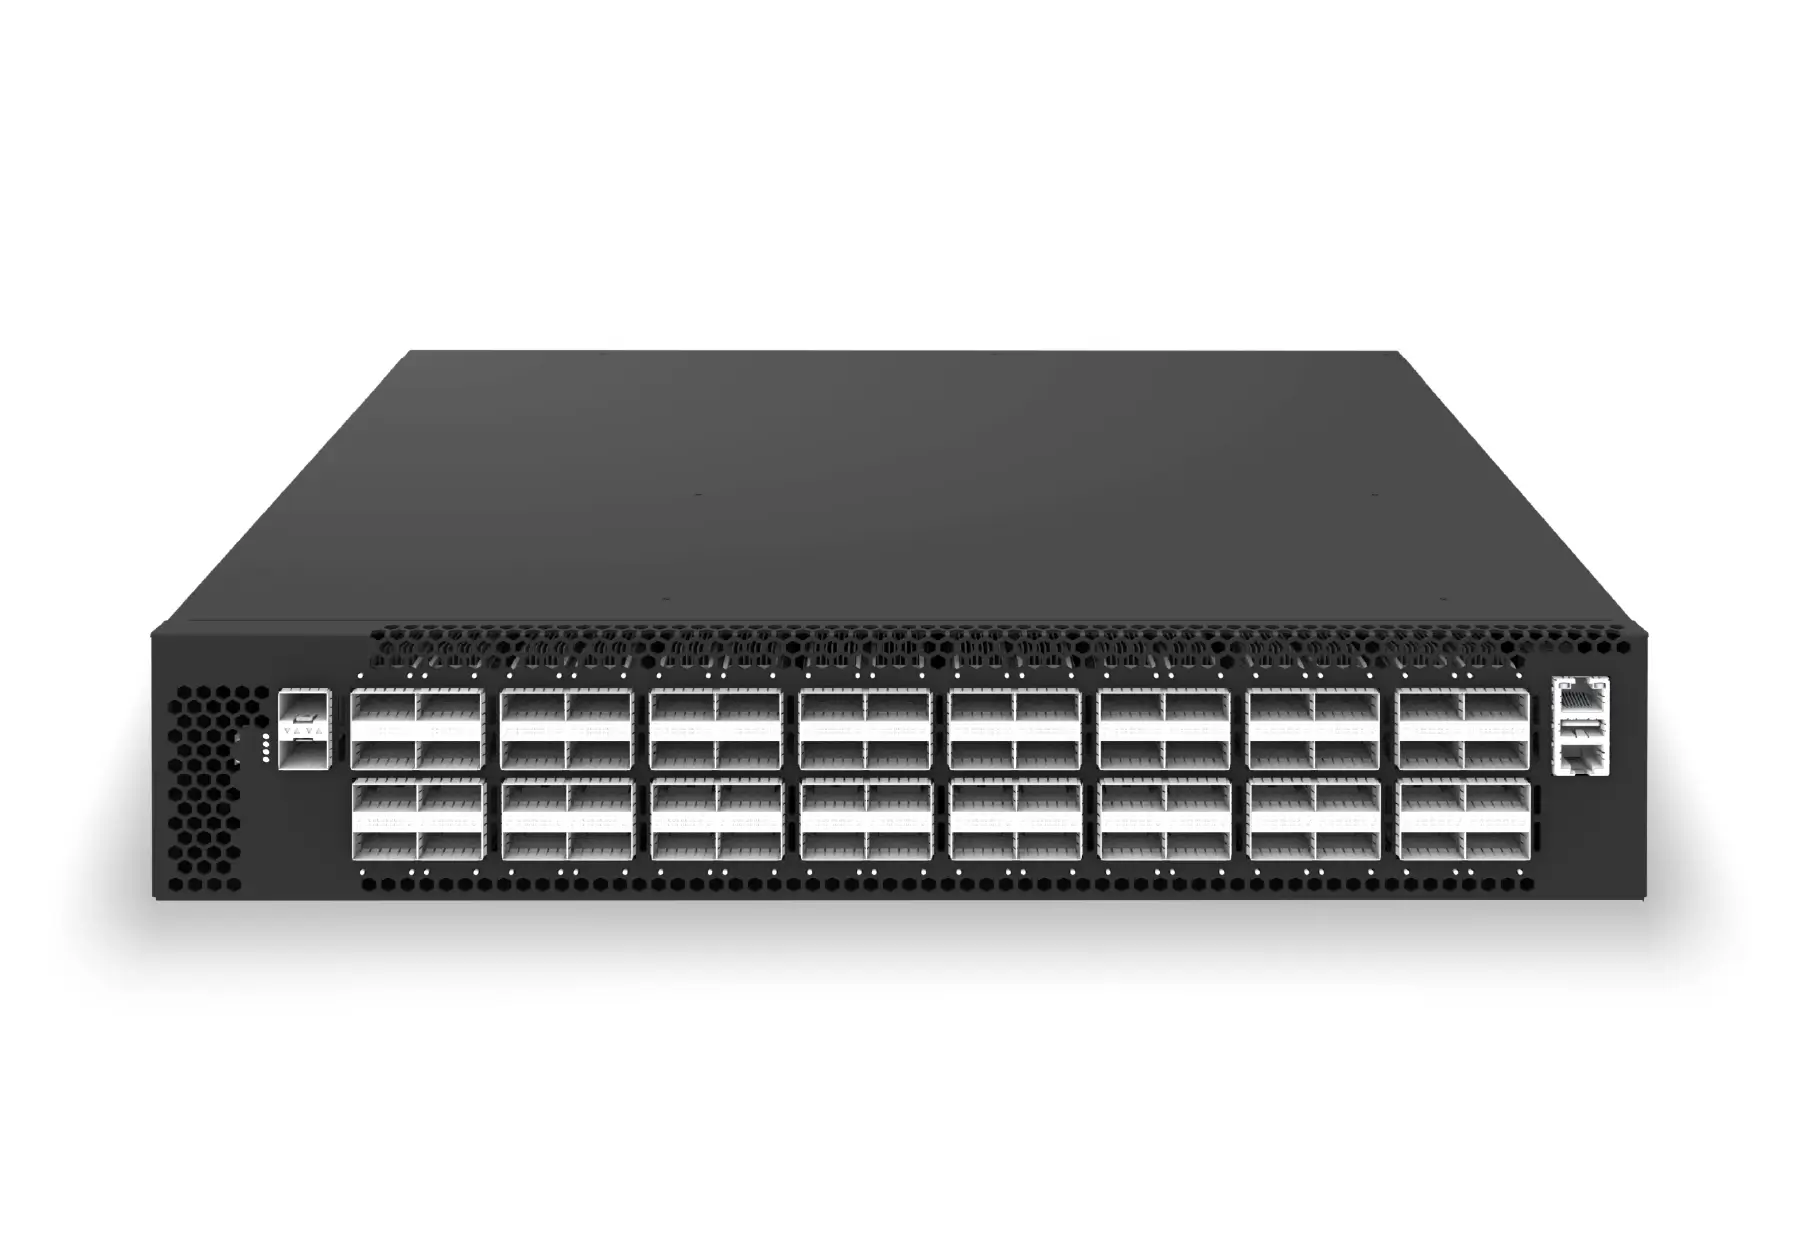 datacenter aiXS-DC-64X200-LS-G164-port 200G leaf/spine switch for high-bandwidth storage, compute, and scale-out data center fabrics.View product
Continue reading
Related articles
 Technical ArticleWhat Enterprise Buyers Actually Get From Open Networking Support: A SONiC Reality CheckA SONiC support reality check for Australian enterprise buyers covering community, commercial distribution, hardware, integration, SLA, and escalation.Read article
 Technical ArticleWarm Reboot and Fast Reboot in SONiC: How to Validate High Availability Without a Full OutageEngineering guide to validating SONiC warm reboot and fast reboot, covering ASIC support, control-plane recovery, traffic loss, telemetry, and rollback.Read article
 Technical ArticleSONiC Security Hardening: A Practical Guide for Data Center Network TeamsA practical SONiC security hardening guide for data center teams covering management access, patching, logging, RBAC, image provenance, telemetry, and audit evidence.Read article