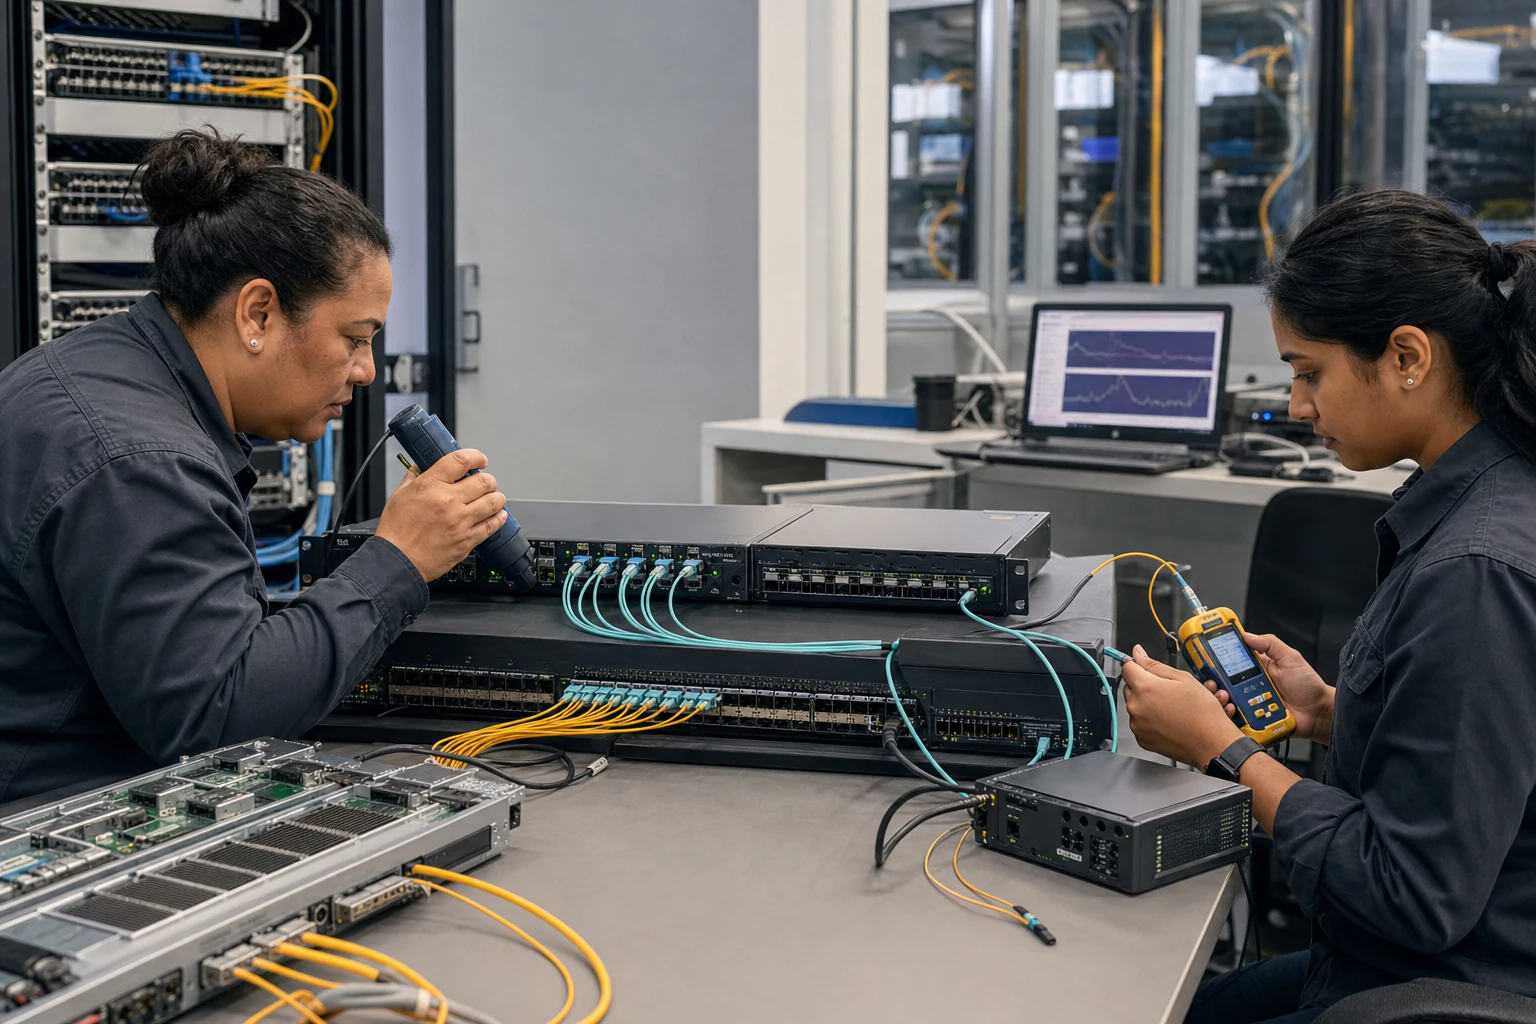
In brief
Engineering guidance on RoCE RDMA and Ethernet Fabric Deployment Validation for Australian network operators, covering gNMI, NETCONF/YANG, OpenConfig, telemetry.
Key takeaways
- AI workload deployment in Australian enterprise and data center environments is accelerating, but the networking layer -- particularly RoCE v2 RDMA fabrics -- often escapes structured security review.
- This gap is not theoretical. Established deployment methodology from SRE and DevOps practice emphasizes that deployment validation must cover configuration, secrets management, network routing, observability instrumentation, access control, and rollback capability.
- For RoCE RDMA fabrics, the deployment artifact is the switch configuration, priority flow control (PFC) parameters, ECN thresholds, DCBX negotiation settings, and telemetry export policies that collectively determine whether AI training jobs can run without packet loss, microbursts, or unauthorized traffic exposure.
Why Security Operations Teams Need a RoCE Fabric Validation Checklist
AI workload deployment in Australian enterprise and data center environments is accelerating, but the networking layer — particularly RoCE v2 RDMA fabrics — often escapes structured security review. When engineering teams build GPU clusters for private LLM inference, RAG pipelines, or multimodal AI services, the focus typically lands on GPU throughput, memory bandwidth, and framework optimization. The Ethernet fabric carrying RDMA traffic receives less scrutiny from security operations teams who are accustomed to inspecting application-layer deployments rather than lossless Ethernet transports.
This gap is not theoretical. Established deployment methodology from SRE and DevOps practice emphasizes that deployment validation must cover configuration, secrets management, network routing, observability instrumentation, access control, and rollback capability. The SRE School’s 2026 deployment framework lists targeted delivery, atomicity, rollbackability, observability, and security/compliance as key deployment properties that apply whether the artifact is a container image or a network fabric configuration.
For RoCE RDMA fabrics, the deployment artifact is the switch configuration, priority flow control (PFC) parameters, ECN thresholds, DCBX negotiation settings, and telemetry export policies that collectively determine whether AI training jobs can run without packet loss, microbursts, or unauthorized traffic exposure. Security operations teams in Australian programs face an additional consideration: alignment with frameworks such as the Australian Signals Directorate (ASD) Essential Eight, APRA CPS 234 for financial services, and the Security of Critical Infrastructure (SOCI) Act for applicable data center operators.
The Deployment Validation Gap: Software Methodology Applied to Network Fabric
The software deployment discipline has matured significantly. As documented in the SRE School’s 2026 deployment guide, modern deployment practice demands idempotency, observability, security, reversibility, and scalability as foundational properties. A standard deployment pipeline includes artifact creation, configuration bundling, target selection, orchestration, verification, promotion or rollback, and auditing.
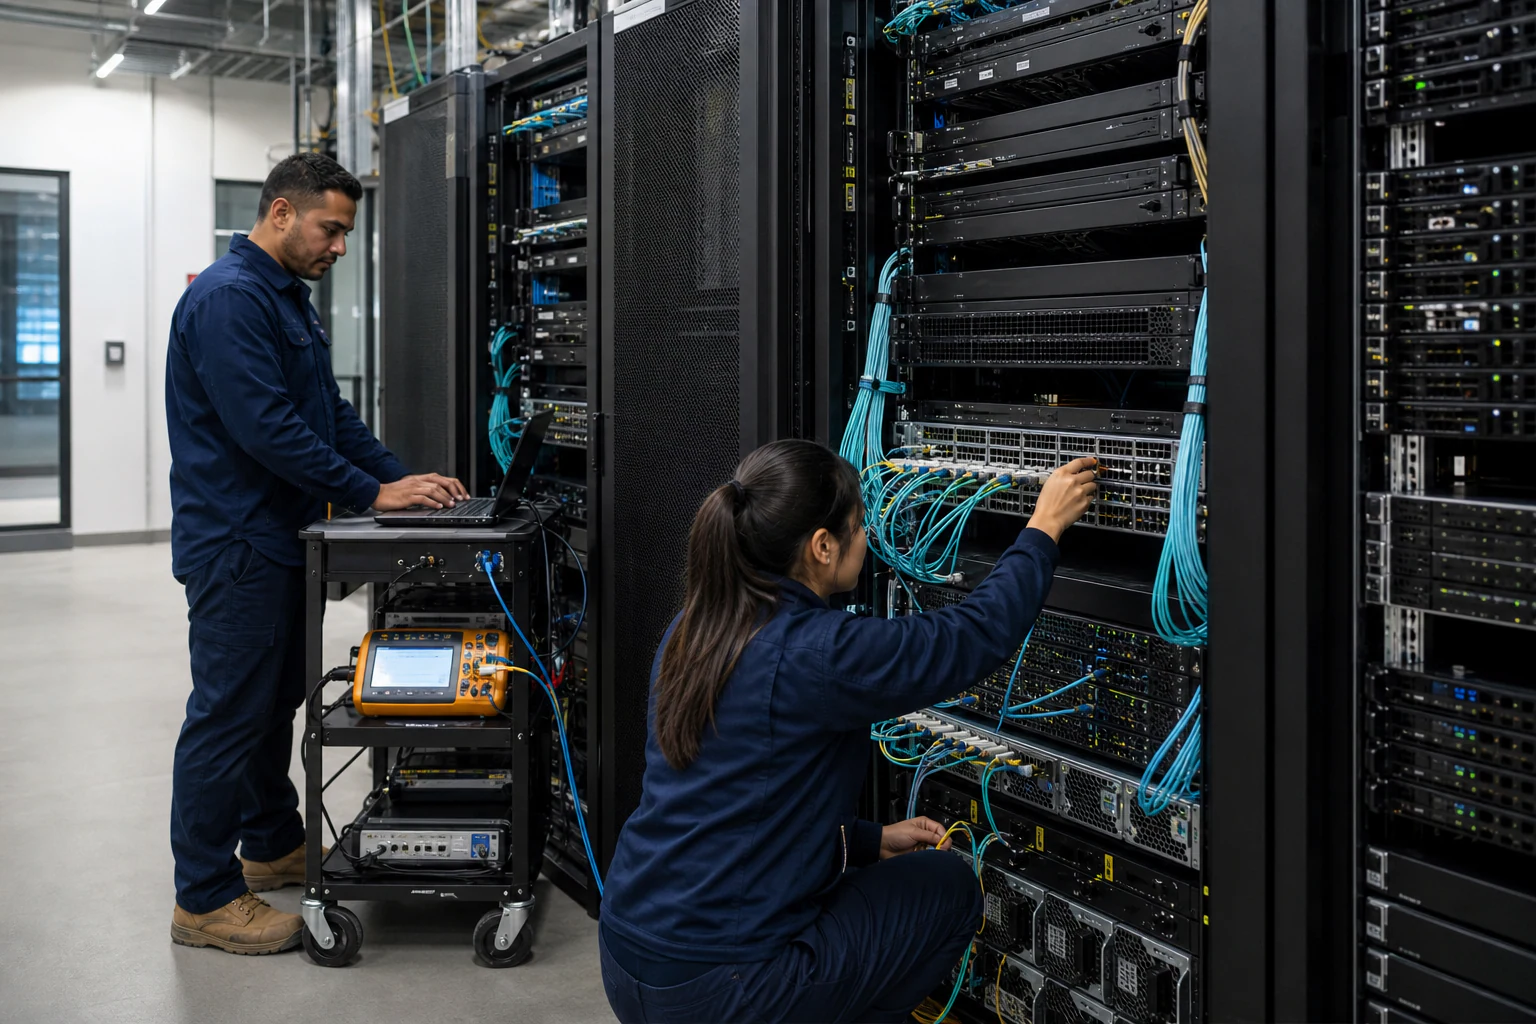
Network fabric deployment for RoCE RDMA — especially in AI cluster environments — has not kept pace with this rigor. Consider the typical AI fabric deployment workflow:
- Switches are racked and cabled.
- Base OS and NOS images are loaded.
- Interface configurations, VLANs, and VRFs are applied.
- PFC and ECN parameters are tuned for RDMA traffic.
- DCBX is enabled to negotiate priority settings.
- Telemetry (INT, IPTPath, or equivalent) is configured.
- The fabric is handed off to the compute team.
What is often missing from this workflow is the structured validation and security gate that software deployment methodology prescribes. The SRE School framework recommends pre-production checklists covering: all tests green and security scans passed, migration compatibility validated, observability hooks present and tested, runbooks and owners assigned. The production readiness checklist adds: deployment can be rolled back within SLA, error budget assessed, monitoring alerts tuned, and load and capacity checks performed.
Translating this to RoCE fabric deployment means security operations teams need their own checklist layer that sits alongside — not inside — the engineering deployment pipeline. This checklist validates that the fabric configuration does not expose management planes, allows unauthorized RDMA traffic, creates unmonitored microburst conditions, or leaves telemetry gaps that would prevent incident detection.
The SRE School deployment framework further identifies common failure modes that map directly to fabric concerns: configuration drift causing misbehavior under real traffic, missing secrets or credentials (analogous to missing ACLs or authentication on management interfaces), resource exhaustion (analogous to buffer saturation and PFC storm conditions), and network partition or misrouting.
Checklist Item 1: RDMA Traffic Segmentation and Access Control Verification
Security operations teams must verify that RoCE v2 traffic is properly segmented from general-purpose data traffic and from management plane traffic. In a typical AI fabric, GPU backend networks carry RDMA traffic on dedicated VLANs or VRFs with priority flow control enabled. If this segmentation is misconfigured, RDMA traffic could leak into general-purpose segments or, conversely, non-RDMA traffic could consume PFC-managed buffer resources.
The validation step requires:
- Confirm VLAN and VRF separation between RDMA backend, management, and front-end networks.
- Verify that ACLs or equivalent filtering prevent unauthorized hosts from injecting RoCE traffic.
- Check that management interfaces (SSH, SNMP, NETCONF, gNMI) are on a separate, access-controlled network segment.
- Validate that DCBX is operating correctly on all RDMA-capable ports and that priority group assignments are consistent.
For open networking platforms running Enterprise SONiC or equivalent NOS, this verification can be scripted and auditable — a significant advantage over proprietary stacks where fabric configuration visibility is limited to vendor-specific management tools. Network packet brokers deployed at fabric interconnect points can provide independent verification of traffic segmentation by filtering and replicating RDMA traffic to security monitoring tools.
Checklist Item 2: Priority Flow Control and ECN Threshold Audit
RoCE v2 relies on Priority Flow Control (PFC) per IEEE 802.1Qbb and Explicit Congestion Notification (ECN) per RFC 3168 to achieve lossless or near-lossless Ethernet behavior required by RDMA. Misconfigured PFC or ECN thresholds are among the most common causes of fabric instability in AI clusters. PFC storms — where pause frames propagate across the fabric and cause cascading stalls — represent a genuine operational and security risk.
Security operations teams should validate:
- PFC is enabled only on designated priority groups, not globally across all ports.
- ECN marking thresholds are consistent across all switches in the fabric.
- PFC watchdog mechanisms are active and configured to detect and mitigate PFC storm conditions.
- Buffer allocation is verified against the expected traffic patterns of the AI workload (training vs. inference have different burst characteristics).
- Fast CNP (Congestion Notification Packet) processing is enabled if the fabric supports it, reducing the feedback loop between congestion detection and source rate adjustment.
The SRE School deployment methodology identifies ‘resource exhaustion’ as a critical failure mode, where new deployments exceed allocated resources and trigger pod evictions or OOM conditions. In the fabric context, the equivalent is buffer exhaustion from unmanaged PFC pauses or microburst accumulation. The mitigation pattern is the same: validate resource allocation before production traffic, implement automated detection, and maintain rollback capability.
Checklist Item 3: Telemetry and Observability for RDMA Fabric
Observability is a non-negotiable requirement in both software deployment and network fabric operations. The SRE School’s deployment framework emphasizes that deployed units must be instrumented for telemetry, and that observability correlation — linking deploy metadata to telemetry — is critical for root cause analysis. The framework warns that missing deploy tags, log sampling gaps during high load, high-cardinality labels, and insufficient tracing are common observability pitfalls.
For RoCE RDMA fabrics, observability means:
- In-band Network Telemetry (INT) is enabled on RDMA paths, providing per-hop latency, queue depth, and congestion visibility.
- IPTPath or equivalent path telemetry captures end-to-end flow characteristics across the fabric.
- SNMP, streaming telemetry (gNMI/gRPC), or syslog export is configured to deliver fabric metrics to a central monitoring platform.
- Telemetry data includes sufficient metadata (switch ID, port, priority group, timestamp) to correlate with AI workload job IDs.
- Packet brokers are deployed at strategic fabric taps to provide independent traffic visibility for security monitoring tools, without impacting RDMA performance.
The operational analogy from software deployment is direct: just as SRE teams tag every deployment with a unique ID and emit events at each pipeline stage, fabric operations teams should tag every configuration change with a change ID and emit telemetry that enables before-and-after comparison.
For security operations specifically, telemetry gaps in an RDMA fabric can mask unauthorized traffic injection, configuration drift, or gradual performance degradation caused by firmware or NOS inconsistencies across the fabric.
Checklist Item 4: Firmware, NOS Image, and Configuration Integrity
The software deployment discipline places significant emphasis on immutable artifacts, image signing, and artifact registry integrity. The SRE School framework states that artifact immutability ensures reproducible deploys and that the common pitfall is untagged or unsigned artifacts. GitOps methodology extends this to declarative desired state stored in version control with reconciliation by controllers.
Applied to network fabric deployment, this translates to:
- NOS images are sourced from verified, versioned builds with cryptographic signatures where available.
- Switch configurations are stored in version control (Git) and applied through declarative tooling (NETCONF/YANG, Ansible with versioned playbooks, or equivalent).
- Configuration drift detection is active, comparing running configuration against declared state.
- Firmware versions for switch ASICs, BMCs, and optical transceiver firmware are documented and consistent across the fabric.
- Optical transceiver modules are validated for compatibility and sourced from verified supply chains (critical for 400G/800G optics in AI fabric deployments).
For Australian programs, the configuration integrity requirement intersects with supply chain security expectations. The SOCI Act and related guidance increasingly emphasize supply chain provenance for critical infrastructure components, which includes networking equipment in data center environments.
Engineering Evidence Floor
For packet broker and traffic visibility topics, accept capacity claims only after replication, filtering, and tool delivery are modelled together. The evidence package should include source links, 95th percentile utilisation, burst peaks, tunnel handling, packet slicing or deduplication, replication factor, tool-port capacity, HA behaviour, and alert ownership. A useful pilot should replay 30 minutes of representative traffic, cover 100G/400G links where present, and include at least 3 failure or tool-overload cases.
| Evidence area | What to validate | Acceptance gate | Rework trigger |
|---|---|---|---|
| Source traffic | Link speed, burst peak, packet mix, and tunnel mix | Model covers current and 12 months growth | Average utilisation drives sizing |
| Replication | Copy count, filters, deduplication, slicing, and load balance | 30 minutes replay with rules enabled | Vendor proof uses clean traffic only |
| Tool delivery | IDS/NDR/SIEM ingress, loss counters, and failover | No sustained drops at broker or tool | Tools overload while broker is healthy |
| Resilience | HA, bypass, link failure, tool failure, and rollback | 3 failure cases documented | Visibility disappears during incidents |
| Audit | Evidence bundle, retention, access control, and ownership | P1 packet evidence ready within 2 hours | Teams debate which data is authoritative |
Engineering FAQ
What should telemetry prove beyond SNMP polling? Telemetry should prove queue behaviour, interface errors, optics health, route state, congestion signals, drops, and config drift at a useful interval. AI and high-speed fabrics often need streaming data rather than periodic polling.
How should gNMI, NETCONF, and YANG be evaluated? Evaluate model coverage, authentication, collector compatibility, update frequency, failure behaviour, and how data maps into the NOC, SIEM, or automation system. Protocol support alone does not prove operational value.
What makes telemetry useful for incident response? Useful telemetry is timestamped, correlated across devices, retained long enough for investigation, and tied to known topology and change events. It should help answer what changed, where congestion occurred, and which tool owns the next action.
Related xSONiC Resources
Sources Reviewed
- Ethernet Network Adapters - ConnectX NICs | NVIDIA
- NVIDIA BlueField Data Processing Unit
- NVIDIA Spectrum-X Ethernet Platform
- OpenConfig gNMI Specification
- OpenConfig
- RFC 7950 - The YANG 1.1 Data Modeling Language
- RFC 6241 - Network Configuration Protocol (NETCONF)
- ACSC Essential Eight
- OAIC Notifiable Data Breaches
- APRA CPS 234 Information Security
- NETSCOUT Network Packet Definition
- Cloudflare Network Packet Definition
- SONiC Project Documentation
- Broadcom Ethernet Switching
- Marvell Switching
- NVIDIA Ethernet Switching
- Open Compute Networking
- SONiC GitHub
- SONiC Foundation
Product fit
Products referenced for evaluation
These products are referenced for evaluation context in the article. Confirm workload, port, optics, software, interoperability, and support requirements against the exact deployment before procurement.
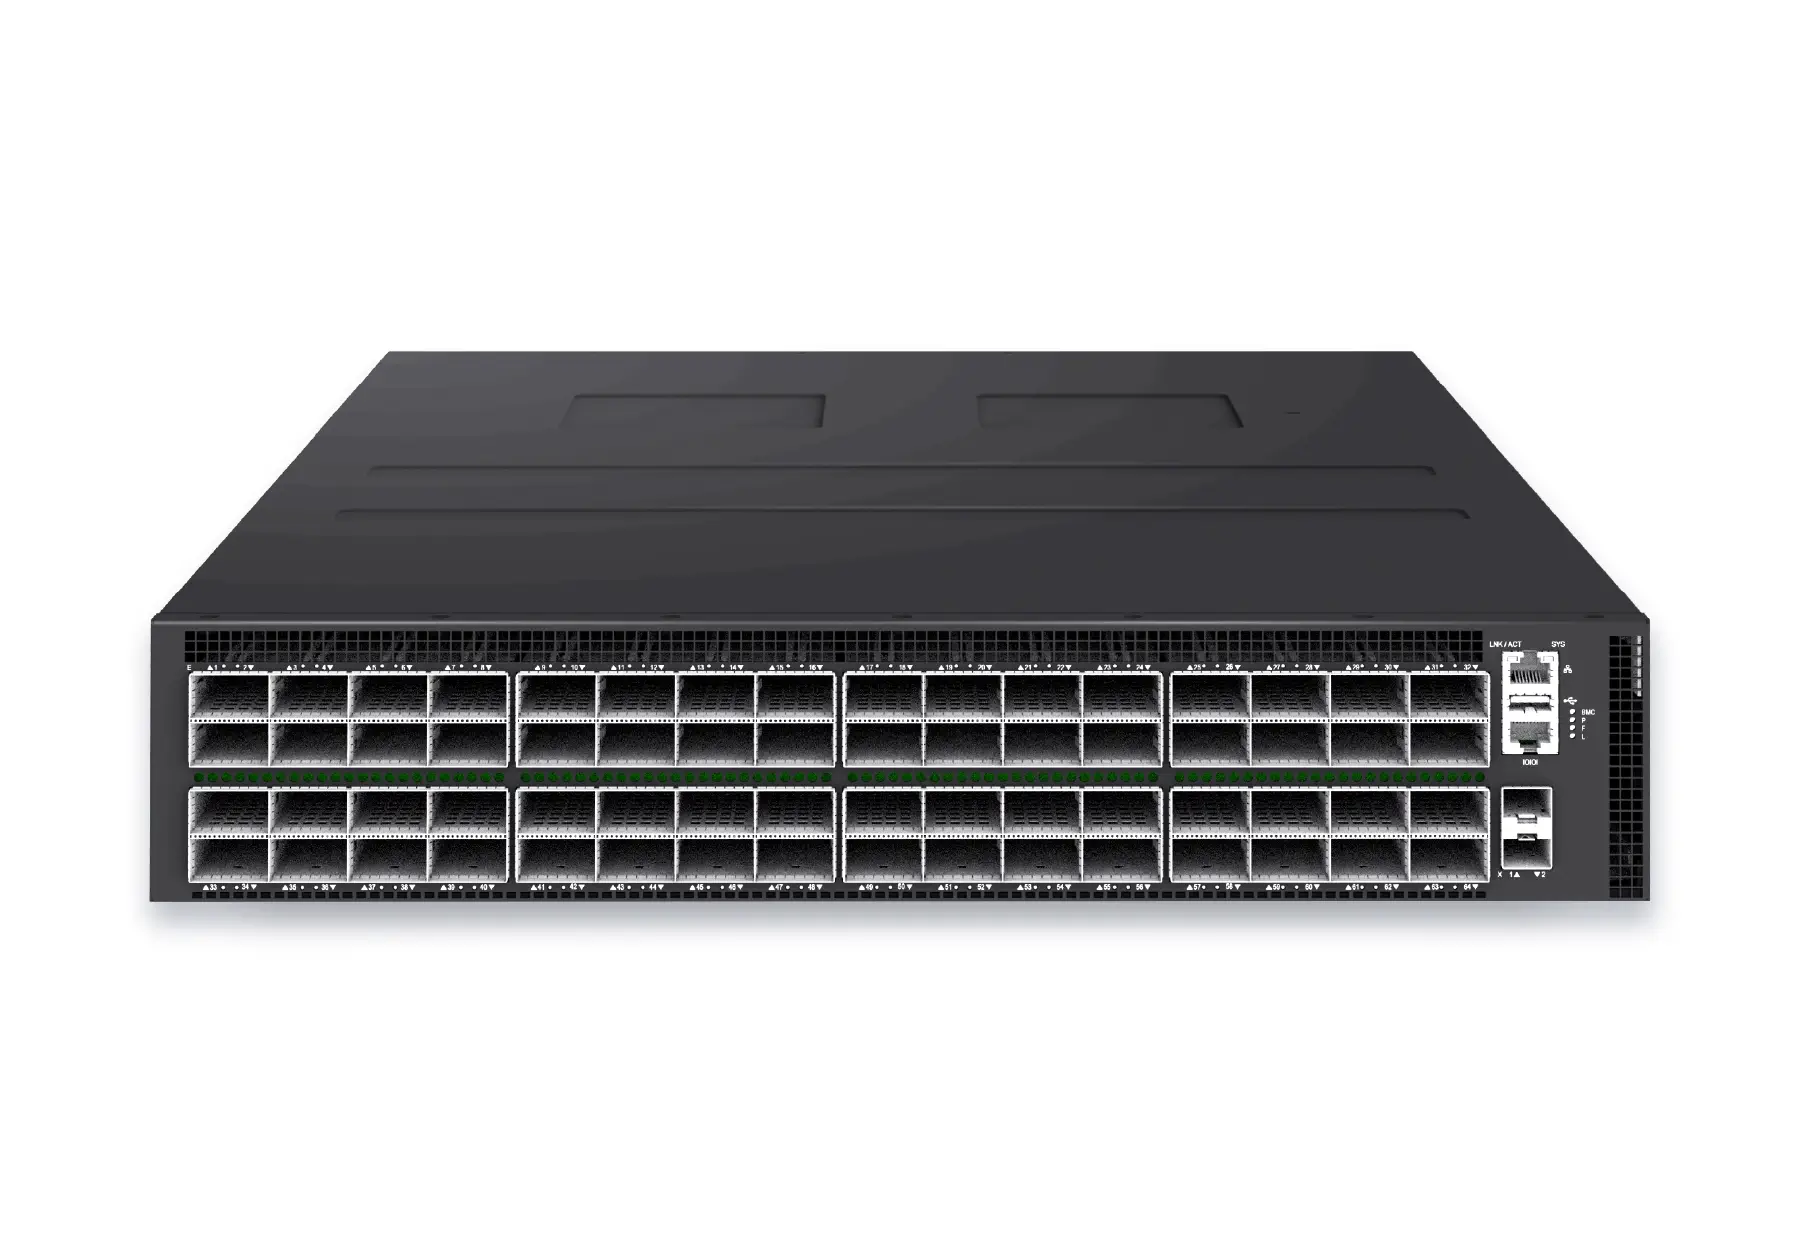 datacenter aiXS-DC-64X800-AI-G164-port 800G AI fabric switch for large-scale GPU clusters, HPC backbones, and ultra-high-throughput data center networks.View product
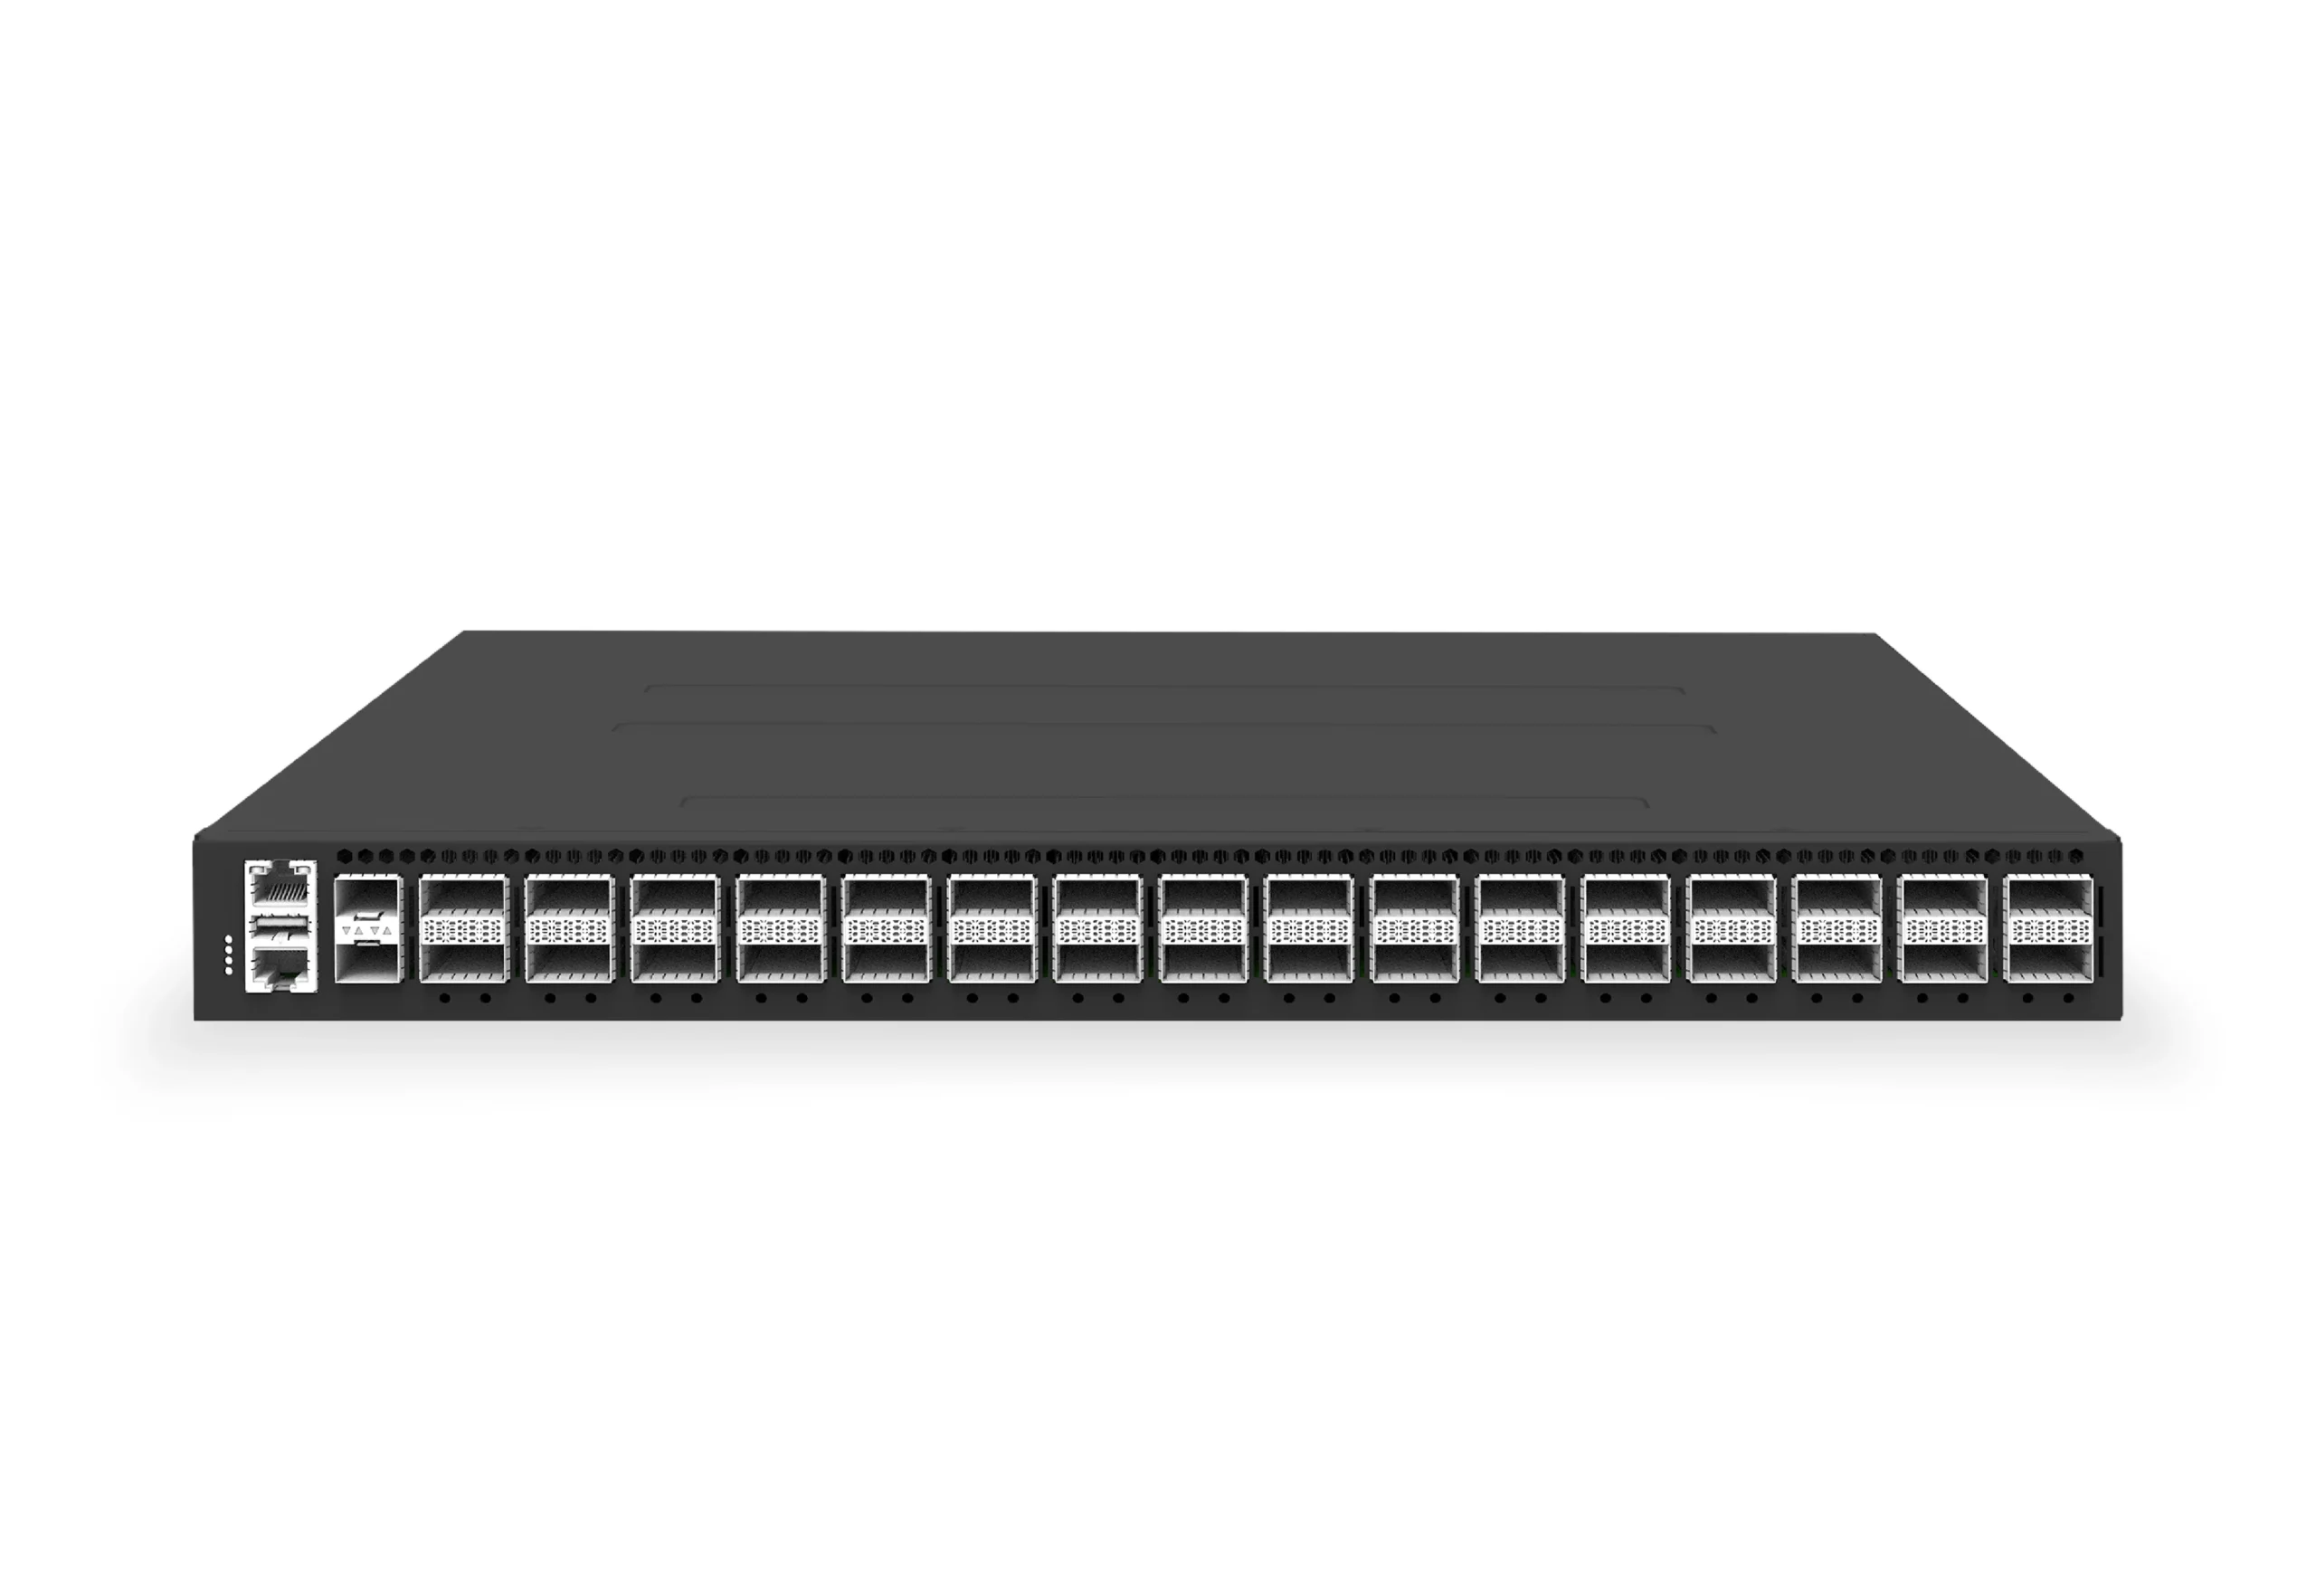 datacenter aiXS-DC-32X400-SP-G232-port 400G spine/core switch for high-capacity data center fabrics and AI-ready backbones.View product
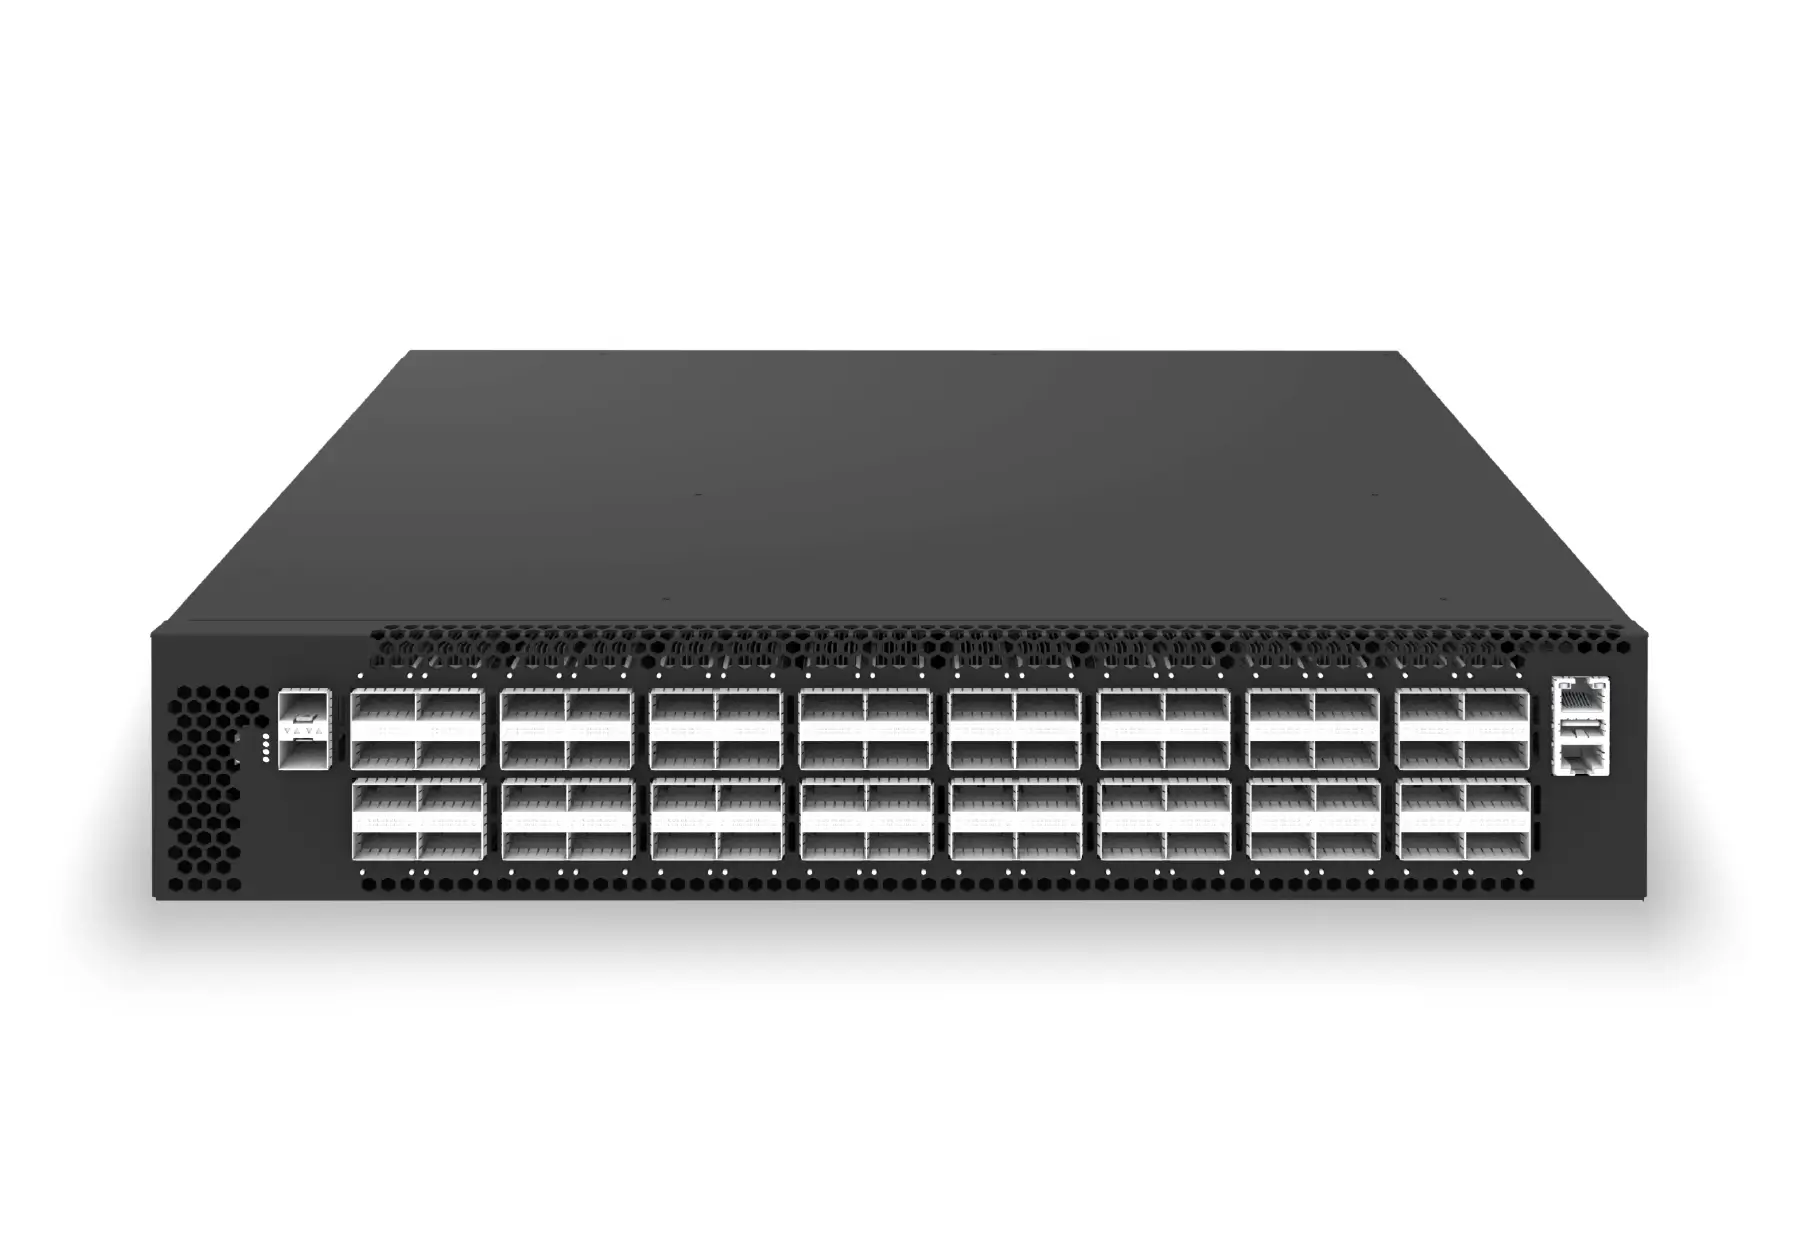 datacenter aiXS-DC-64X200-LS-G164-port 200G leaf/spine switch for high-bandwidth storage, compute, and scale-out data center fabrics.View product
Continue reading
Related articles
 Technical ArticleHow SONiC-Powered 400G and 800G Switches Change AI Data Center Fabric Design in AustraliaEngineering guide for 400G and 800G optics planning covering form factor, reach, telemetry, thermal limits, supply risk, and validation.Read article
 Technical ArticleRoCE v2 GPU Backend Fabrics at 400G and 800G: What Australian Data Center Operators Need to Know in 2026Engineering guide for AI fabric buyers covering RoCE, SONiC, telemetry, optics, support ownership, and deployment validation.Read article
 Technical ArticleWhat Australian Data Center Buyers Need to Know Before Choosing SONiC Switches for 400G and 800G UpgradesEngineering guide for 400G and 800G optics planning covering form factor, reach, telemetry, thermal limits, supply risk, and validation.Read article