In brief
Engineering use cases for packet brokers in observability, performance troubleshooting, AI fabrics, compliance capture, and multi-tool delivery.
Key takeaways
- Packet brokers are useful when visibility requirements exceed the capacity or precision of simple mirroring.
- This article focuses on network operations and observability use cases.
- Large campuses and data centres often have many observation points and fewer tools.
Engineering Position
Packet brokers are useful when visibility requirements exceed the capacity or precision of simple mirroring. For observability teams, the value is not just more packets. The value is controlled packet evidence that can be correlated with flow records, device counters, logs, and telemetry.
This article focuses on network operations and observability use cases. Security-specific use cases overlap, but the operational question is different: can the team explain application slowdown, packet loss, congestion, and path behaviour with enough evidence to fix the issue?
Use Case 1: Multi-Link Traffic Aggregation
Large campuses and data centres often have many observation points and fewer tools. A packet broker aggregates traffic from TAPs, SPAN sessions, virtual TAPs, and cloud on-ramps into a controlled tool-delivery layer.
Failure without broker: tools see one link at a time and miss the transaction path.
Broker design: aggregate sources by site, rack, VLAN, VNI, or service boundary; then forward scoped feeds to NPM, APM, and packet capture platforms.
Validation: trace a known test transaction across multiple links and confirm the tool receives every required segment of the path.
Use Case 2: Packet-Level Troubleshooting
Flow records show conversation summaries. They often do not show retransmission detail, handshake failures, sequence behaviour, MTU issues, or payload timing. Packet capture remains necessary for difficult incidents.
Failure without broker: operations teams know a service is slow but cannot prove whether the cause is network loss, server delay, TLS negotiation, DNS latency, or application behaviour.
Broker design: deliver full packets during short incident windows and sliced headers for longer retention. Use RFC 9293 TCP fields and RFC 791/RFC 8200 IP fields as the basis for filter and diagnosis policy.
Validation: reproduce an issue and confirm the capture includes timing, direction, TCP flags, retransmissions, and both sides of the flow.
Use Case 3: AI Fabric Observability
AI fabrics create high-volume east-west traffic where packet loss, queueing, or path imbalance can reduce GPU utilisation. A packet broker should not replace INT, IPFIX, or switch counters; it should complement them with targeted packet evidence.
Failure without broker: the team sees GPU job slowdown but cannot connect it to a path, queue, traffic class, or workload flow.
Broker design: filter by rack, workload subnet, VNI, VLAN, RoCE-related traffic class, or test window. Send packet evidence to capture tools while INT/path telemetry and flow records explain fabric behaviour.
Validation: during a workload-like run, correlate packet captures, broker counters, IPFIX records, and switch telemetry for the same flow set.
Use Case 4: Tool Load Control
Tools fail quietly when they ingest more than they can process. Packet brokers protect tool capacity by filtering, slicing, deduplicating, and load balancing before traffic reaches the tool tier.
Failure without broker: a tool drops internally during a peak, but dashboards still imply normal operation.
Broker design: enforce per-tool policies: full payload for capture, headers for NPM, selected protocols for APM, and metadata or flow records for analytics.
Validation: push peak-like traffic and verify broker egress counters, tool interface counters, and tool application health all remain inside thresholds.
Use Case 5: Overlay and Tunnel Visibility
Modern fabrics often use VXLAN or EVPN overlays; service-provider and hybrid designs may include GRE or MPLS. RFC 7348, RFC 7432, RFC 2784, and RFC 3031 define these encapsulations. Observability tools that only read outer headers may miss the actual workload conversation.
Failure without broker: tools see VTEP-to-VTEP or tunnel endpoint traffic but not the inner application flow.
Broker design: match outer and inner headers, strip tunnel headers where required, and preserve VNI or tenant context for correlation.
Validation: capture a known inner flow through the overlay and confirm the tool receives the expected source, destination, ports, protocol, and VNI context.
Use Case 6: Capacity Planning
Packet brokers can help quantify what the tool layer is actually asked to process. This is useful when planning a refresh from 25G/100G to 400G/800G data centre links or when adding AI workloads to an existing fabric.
Failure without broker: capacity planning relies only on switch interface utilisation and ignores tool-ingest limits.
Broker design: report ingress traffic, filtered traffic, replicated traffic, egress traffic, drops, and backpressure per tool group.
Validation: compare raw source volume with delivered tool volume and document why each reduction occurred.
Buyer Checklist
| Question | Why it matters |
|---|---|
| What flows need full packet evidence? | Prevents wasteful capture of everything. |
| Which tools require bidirectional flow symmetry? | Avoids broken IDS/NPM analysis after load balancing. |
| Which fields are filter keys? | Drives ASIC/filter pipeline requirements. |
| Which tunnels exist? | Determines whether VXLAN, GRE, MPLS, and EVPN handling is required. |
| What is the packet-rate peak? | Gbps alone can hide packet processing limits. |
| How are policies audited? | Makes visibility evidence useful during incidents. |
xSONiC Fit
xSONiC packet broker platforms should be evaluated alongside data center switches, AI fabric, INT telemetry, IPTPath telemetry, and AIDC controller requirements. The broker is the packet-delivery layer; telemetry and control systems provide path context and automation.
Bottom Line
For observability teams, packet brokers make packet evidence usable at scale. They reduce noise, protect tool capacity, and let operations teams correlate packets with flows, counters, and telemetry instead of guessing from partial captures.
Engineering Evidence Floor
For packet broker and traffic visibility topics, accept capacity claims only after replication, filtering, and tool delivery are modelled together. The evidence package should include source links, 95th percentile utilisation, burst peaks, tunnel handling, packet slicing or deduplication, replication factor, tool-port capacity, HA behaviour, and alert ownership. A useful pilot should replay 30 minutes of representative traffic, cover 100G/400G links where present, and include at least 3 failure or tool-overload cases.
| Evidence area | What to validate | Acceptance gate | Rework trigger |
|---|---|---|---|
| Source traffic | Link speed, burst peak, packet mix, and tunnel mix | Model covers current and 12 months growth | Average utilisation drives sizing |
| Replication | Copy count, filters, deduplication, slicing, and load balance | 30 minutes replay with rules enabled | Vendor proof uses clean traffic only |
| Tool delivery | IDS/NDR/SIEM ingress, loss counters, and failover | No sustained drops at broker or tool | Tools overload while broker is healthy |
| Resilience | HA, bypass, link failure, tool failure, and rollback | 3 failure cases documented | Visibility disappears during incidents |
| Audit | Evidence bundle, retention, access control, and ownership | P1 packet evidence ready within 2 hours | Teams debate which data is authoritative |
This section deliberately avoids treating the topic as a feature checklist. The buyer should be able to hand the evidence to engineering, security, finance, and support teams and have each group understand what was tested, what failed, what was accepted, and what still needs rework. That is also the content pattern most useful for generative search: the page states a clear conclusion, names measurable parameters, identifies risk, and cites the operational proof required before deployment.
Engineering FAQ
How should a team decide which traffic gets full packets and which gets metadata only? Start from the incident questions the tools must answer. Full packets are justified for short forensic windows, protocol troubleshooting, and hard-to-reproduce application issues. Headers, flow records, or sliced packets are usually better for long retention, capacity planning, and privacy-sensitive environments.
What is the most common packet broker design mistake? Oversubscribing the broker-to-tool side without measuring packet rate. Gbps capacity can look healthy while small-packet bursts overwhelm tools. Acceptance testing should include packets per second, burst behaviour, drops, and per-tool symmetry, not just interface bandwidth.
Should packet brokers replace switch telemetry? No. Packet brokers provide selected evidence; switch telemetry explains fabric state. For AI fabrics and high-speed data centres, use both: counters, INT/IPFIX, and path telemetry to identify where a condition exists, then packet evidence to prove what happened at the flow level.
Where does xSONiC fit in a broker-led observability design? xSONiC should be evaluated where packet delivery, SONiC fabric telemetry, and tool integration meet. The design goal is a controlled evidence pipeline from production links to NPM, NDR, packet capture, and compliance tools without overfeeding any single system.
Related xSONiC Resources
Sources Reviewed
- Ethernet Network Adapters - ConnectX NICs | NVIDIA
- NVIDIA BlueField Data Processing Unit
- NVIDIA Spectrum-X Ethernet Platform
- ACSC Essential Eight
- OAIC Notifiable Data Breaches
- APRA CPS 234 Information Security
- NETSCOUT Network Packet Definition
- Cloudflare Network Packet Definition
- SONiC Project Documentation
- Broadcom Ethernet Switching
- Marvell Switching
- NVIDIA Ethernet Switching
- Open Compute Networking
- SONiC GitHub
- SONiC Foundation
Product fit
Products referenced for evaluation
These products are referenced for evaluation context in the article. Confirm workload, port, optics, software, interoperability, and support requirements against the exact deployment before procurement.
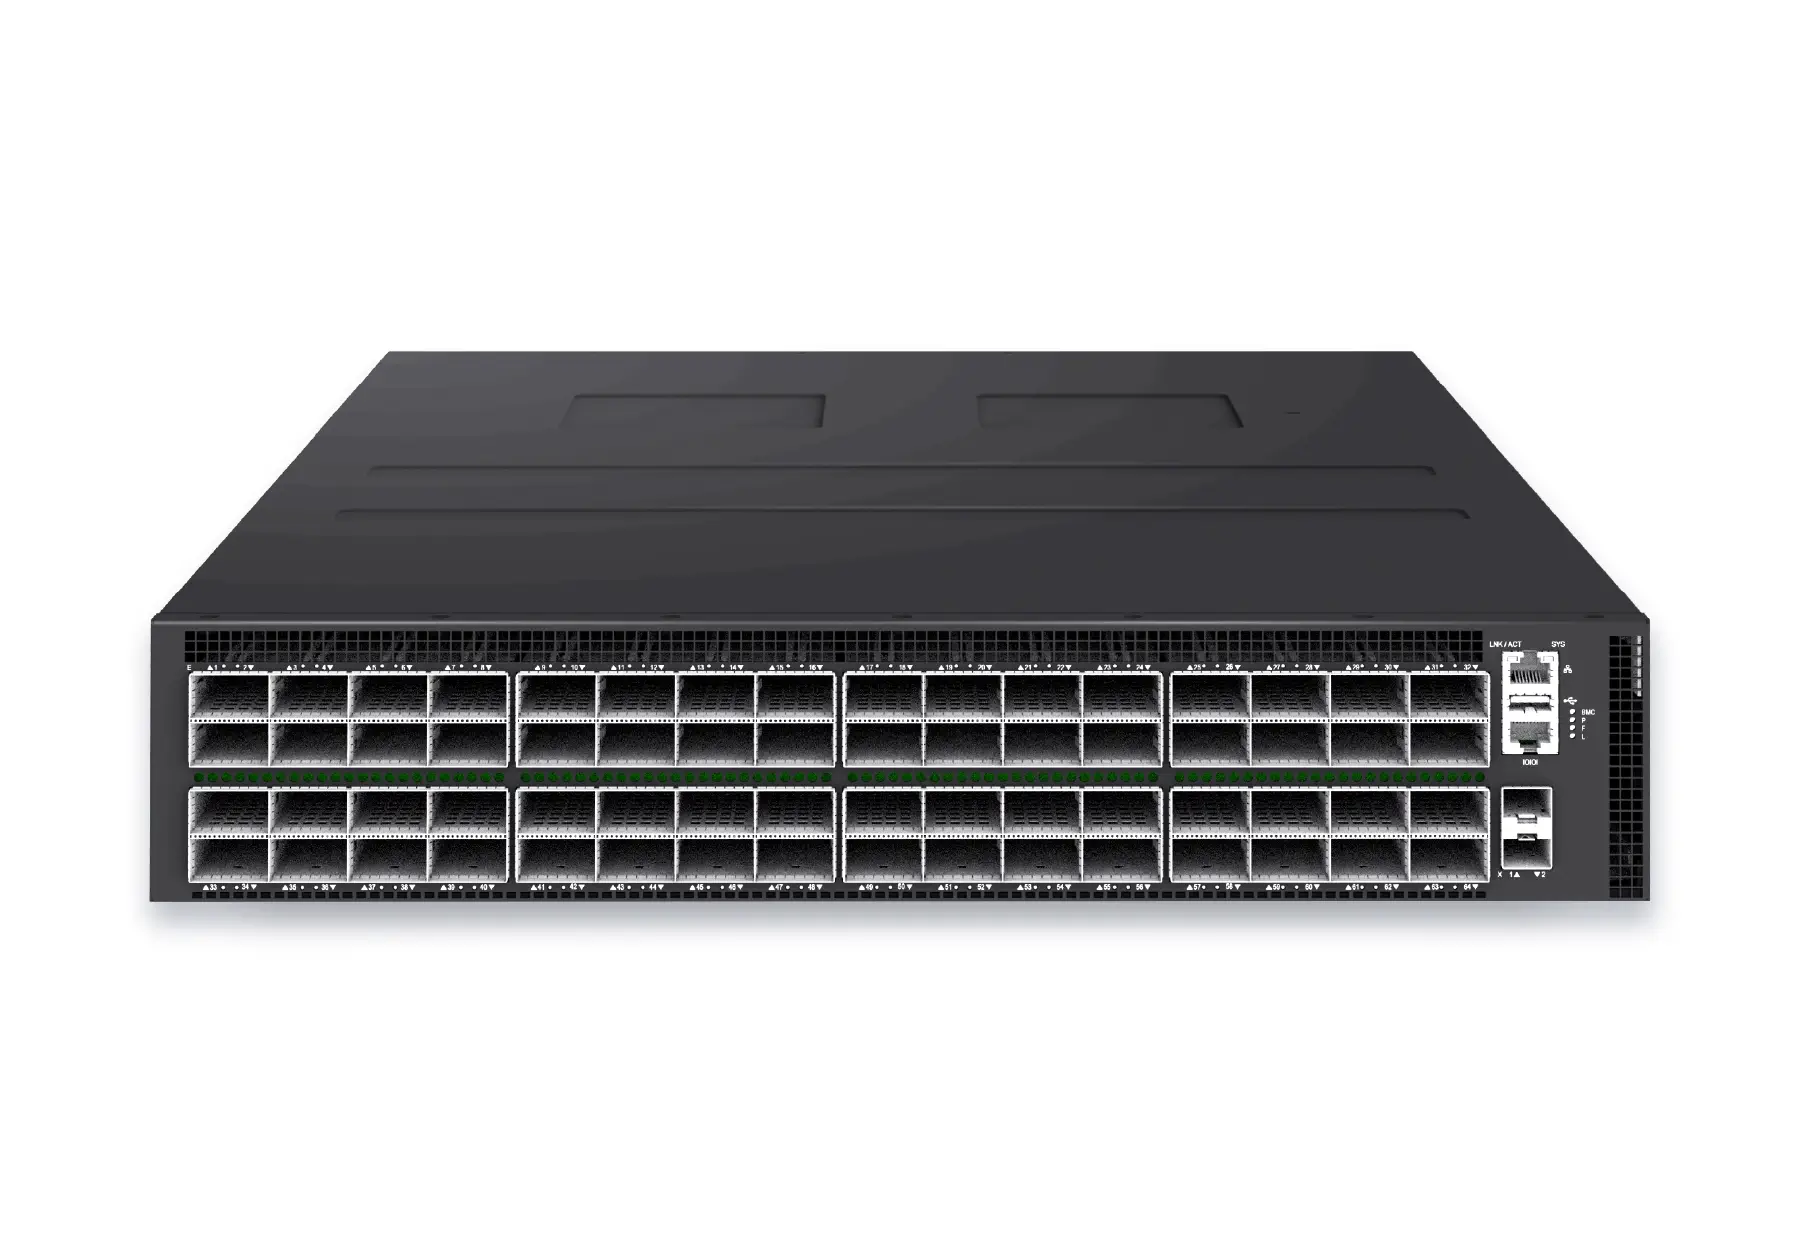 datacenter aiXS-DC-64X800-AI-G164-port 800G AI fabric switch for large-scale GPU clusters, HPC backbones, and ultra-high-throughput data center networks.View product
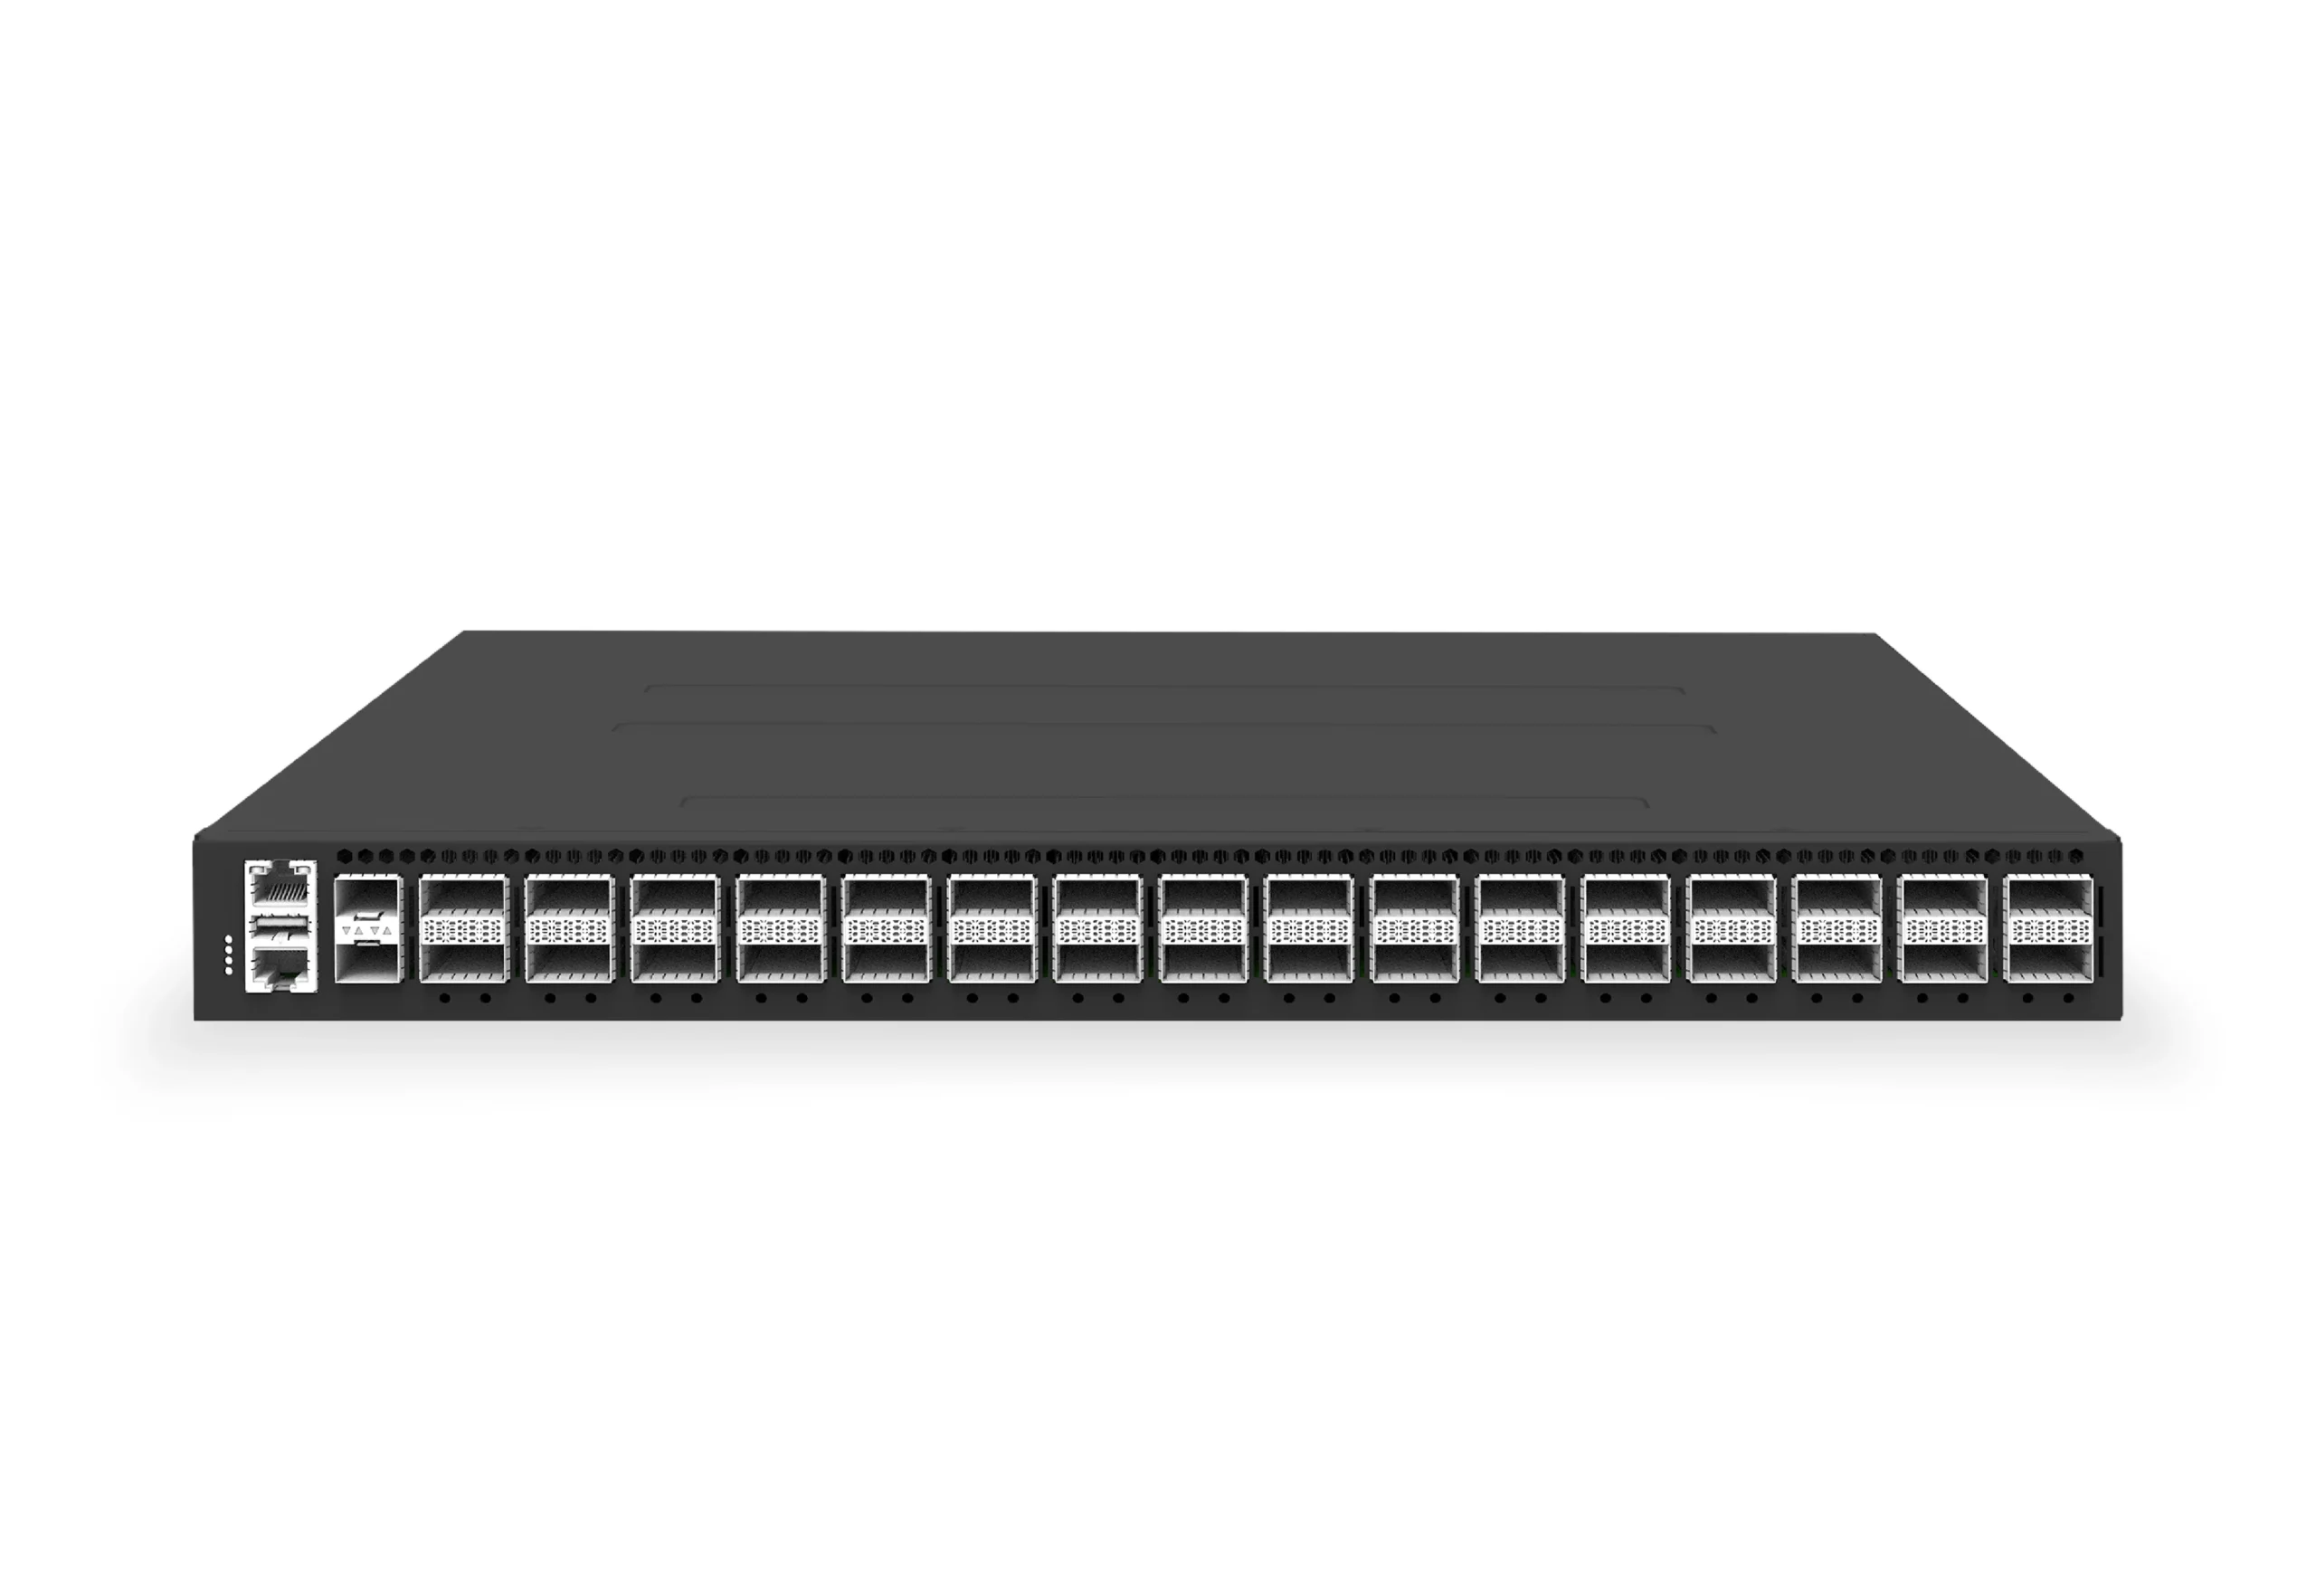 datacenter aiXS-DC-32X400-SP-G232-port 400G spine/core switch for high-capacity data center fabrics and AI-ready backbones.View product
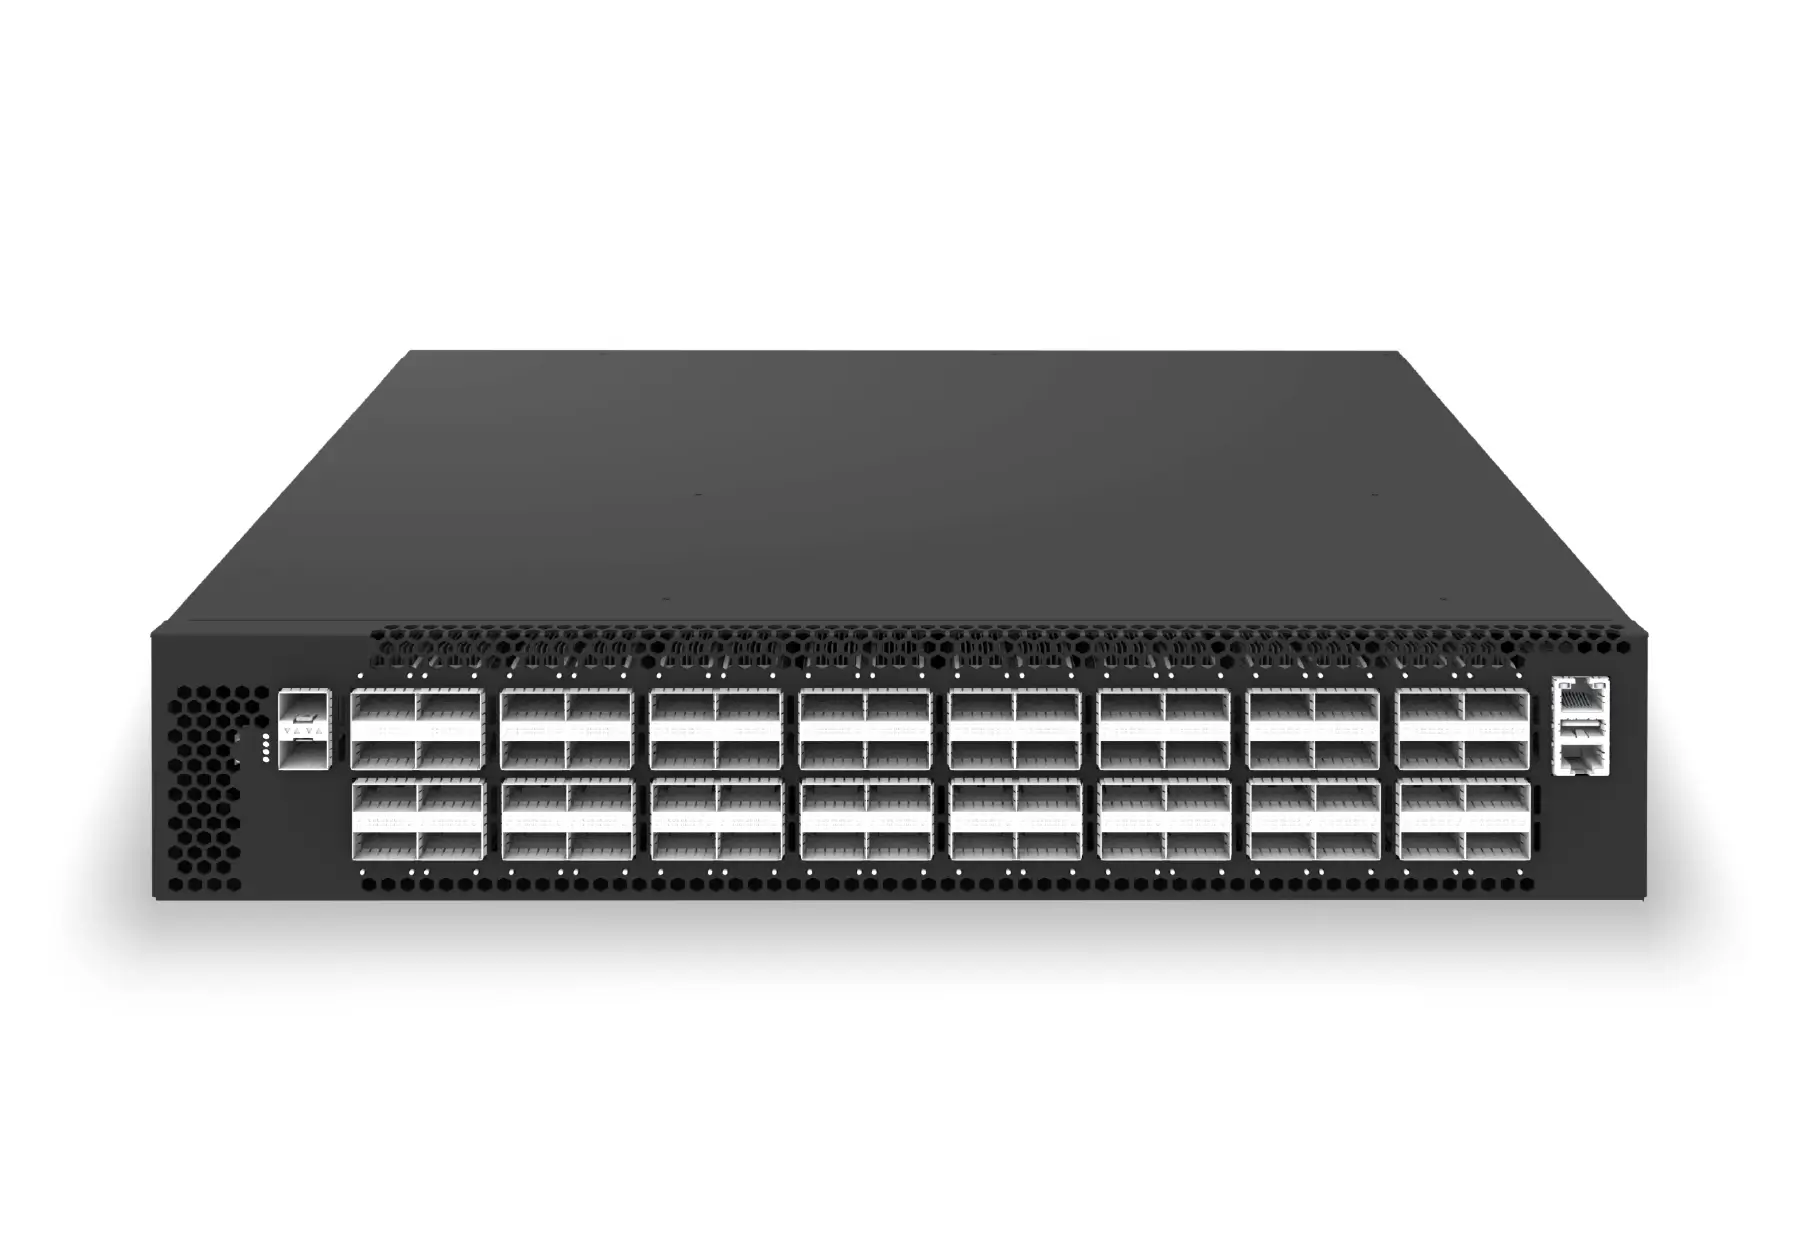 datacenter aiXS-DC-64X200-LS-G164-port 200G leaf/spine switch for high-bandwidth storage, compute, and scale-out data center fabrics.View product
Continue reading
Related articles
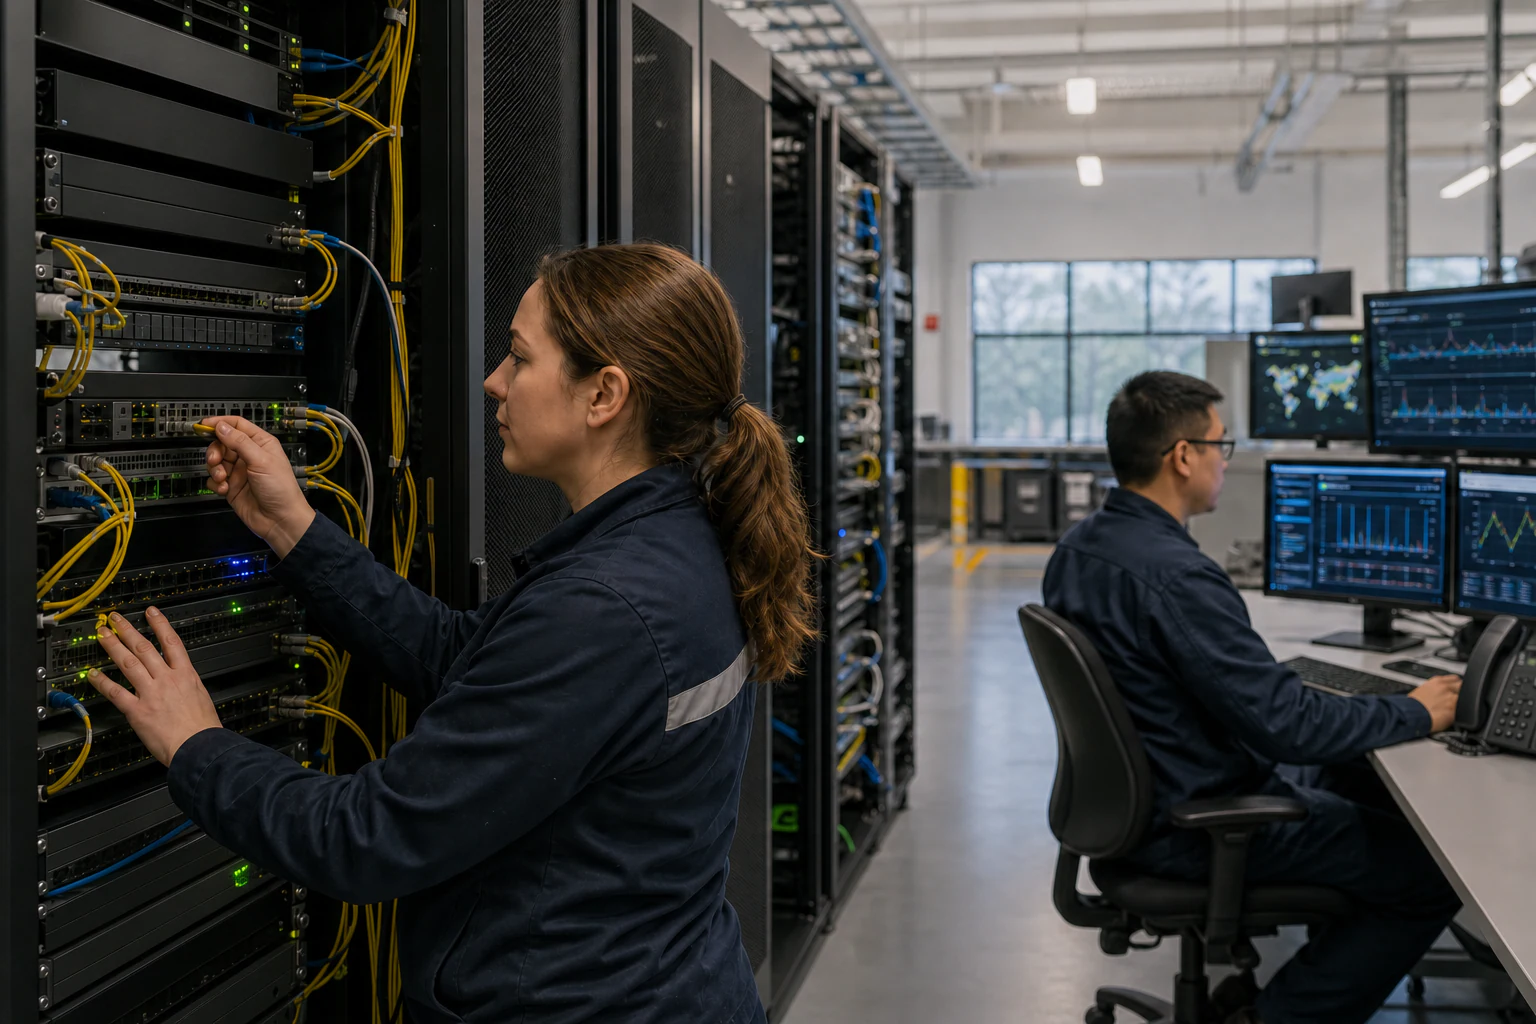 Technical ArticleHow Packet Brokers Filter, Replicate and Load-Balance TrafficEngineering guide for packet broker and visibility planning covering traffic capacity, filtering, tool delivery, resilience, and audit evidence.Read article
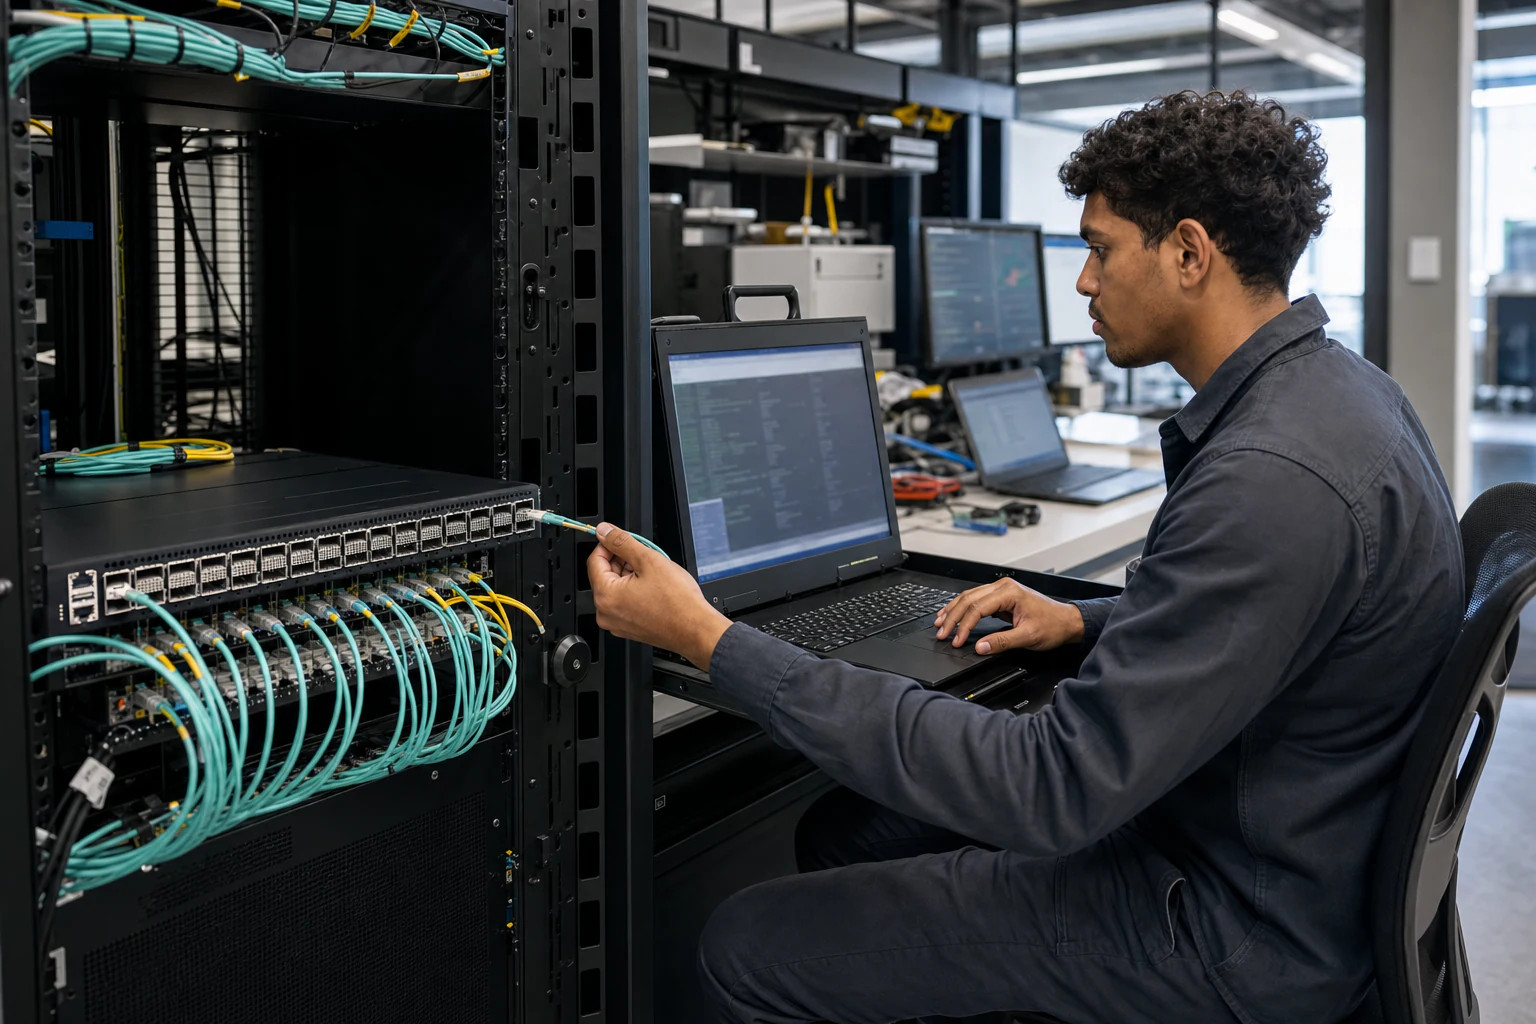 Technical ArticleWhy AI Data Centers Need In-Band Network Telemetry -- And Where Open SONiC FitsINT and path telemetry guide for AI fabric observability, covering SONiC support, RoCE congestion, telemetry pipelines, and buyer risk.Read article
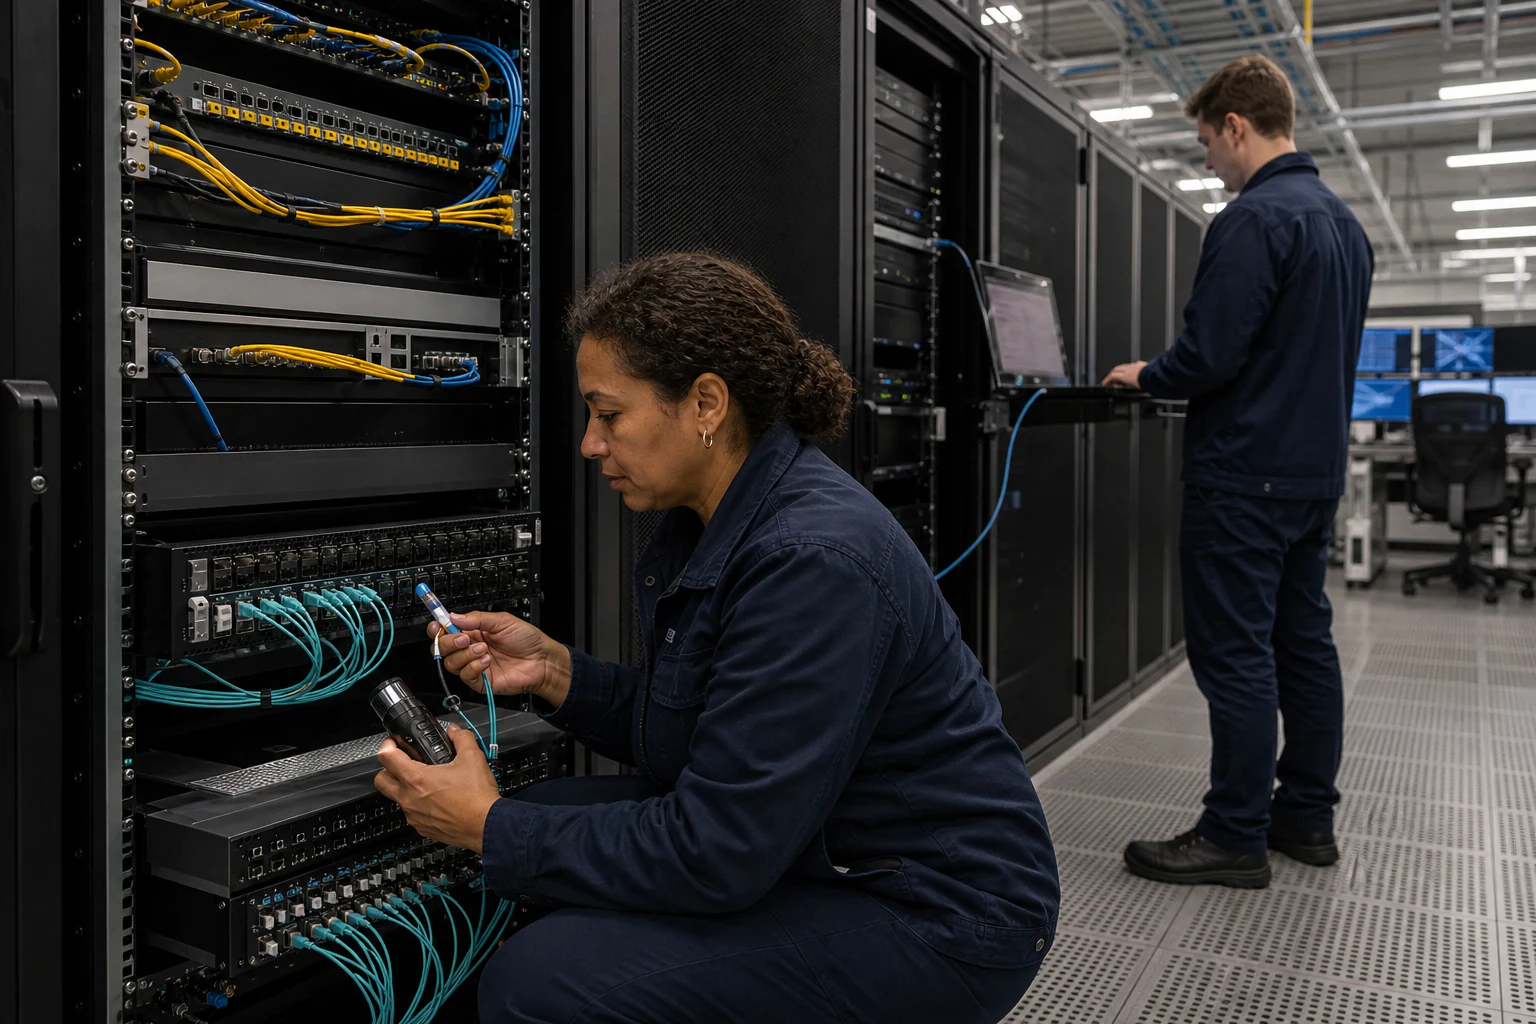 Technical ArticleINT Telemetry and Path Visibility: Why AI Data Centers Need Hop-by-Hop Insight on SONiC FabricsEngineering guide to INT telemetry and path visibility for AI data centers, covering hop latency, queue depth, RoCE, packet brokers, and SONiC.Read article