In brief
Guide for Australian AI platform teams on GPU network observability, covering telemetry, packet brokers, sovereignty, and inference fabric risk.
Key takeaways
- Australian enterprises moving AI inference workloads on-premises or into sovereign colocation facilities face a networking challenge that does not exist in traditional application hosting: GPU backend fabrics carrying RoCE v2 traffic must be lossless and sub-microsecond-latency, or inference jobs stall, time out, or return degraded results.
- When a 70-billion-parameter inference model distributed across multiple GPU nodes starts experiencing tail latency spikes, the platform team needs to know whether the cause is a congested spine port, a misaligned DCBX negotiation, or a CNP (congestion notification packet) processing delay.
- Software for Open Networking in the Cloud (SONiC) is an open-source network operating system based on Linux that runs on switches from multiple vendors and ASICs.
The Observability Gap in Private AI Inference Networking
Australian enterprises moving AI inference workloads on-premises or into sovereign colocation facilities face a networking challenge that does not exist in traditional application hosting: GPU backend fabrics carrying RoCE v2 traffic must be lossless and sub-microsecond-latency, or inference jobs stall, time out, or return degraded results. The problem is that most enterprise network monitoring stacks were designed for TCP-based application traffic, not for RDMA congestion notification, priority flow control (PFC) queue behavior, or per-flow telemetry from switch ASICs.
When a 70-billion-parameter inference model distributed across multiple GPU nodes starts experiencing tail latency spikes, the platform team needs to know whether the cause is a congested spine port, a misaligned DCBX negotiation, or a CNP (congestion notification packet) processing delay. Traditional SNMP polling at 5-minute intervals cannot answer that question. Neither can application performance monitoring (APM) tools that only see the software layer. The observability gap sits in the network fabric itself, and for Australian programs running private inference under data sovereignty constraints, closing that gap is not optional.
What SONiC and Open Networking Change About Visibility
Software for Open Networking in the Cloud (SONiC) is an open-source network operating system based on Linux that runs on switches from multiple vendors and ASICs. The SONiC Foundation, a Linux Foundation project, describes SONiC as offering a full suite of network functionality including BGP and RDMA, production-hardened in large-scale cloud provider data centers. Its container-based architecture decomposes network functions into modular Docker containers, which means telemetry agents, streaming telemetry exporters, and monitoring hooks can be added or updated without replacing the entire NOS.
For AI platform teams, this matters because observability is not a single product — it is a pipeline: the switch ASIC must export flow and queue data, the NOS must stream it in real time, and a collector or packet broker must aggregate, filter, and deliver it to the monitoring stack. SONiC’s open architecture and its integration with the Switch Abstraction Interface (SAI) mean that telemetry capabilities are not locked behind a single vendor’s roadmap. Teams can deploy INT (In-band Network Telemetry) capable switches, enable IPTPath telemetry, and feed that data into open or commercial observability platforms.
The OCP Networking project, under which SONiC operates as a sub-project alongside SAI and ONIE, describes its scope as ‘fully disaggregated and open networking HW and SW’ including Linux-based operating systems, developer tools, REST APIs, fully automated configuration management, and bare metal provisioning. This disaggregated model gives Australian enterprise teams the ability to choose best-of-breed switching hardware, run SONiC as the NOS, and build a telemetry pipeline that they control end to end — a critical requirement for sovereign AI programs where data path visibility cannot depend on a foreign vendor’s cloud-hosted analytics platform.
NVIDIA Spectrum-X and the AI Ethernet Observability Stack
NVIDIA’s Spectrum Ethernet switch portfolio, including the Spectrum-X platform designed for AI workloads, illustrates how the market is responding to the observability demand. NVIDIA offers Pure SONiC as one of its supported network operating systems alongside Cumulus Linux, and provides NetQ as a real-time operations tool for ‘holistic, real-time visibility, troubleshooting, and lifecycle management’ of data center networks. The Spectrum-4 SN5000 series is described as purpose-built for AI, with speeds up to 800 Gb/s and features including 512K flow counters and 512K ACL entries.
For Australian AI platform teams, the combination of an open NOS like SONiC with hardware that exports rich ASIC-level telemetry creates an observability foundation that proprietary switch stacks typically monetize as premium licensed features. The buyer calculus for a sovereign private inference deployment is straightforward: if the telemetry data stays on-premises, the NOS is open source, and the switch hardware is multi-vendor through SAI, then the platform team retains operational control. This is not about avoiding vendor support — it is about ensuring that the observability pipeline does not create a new data sovereignty exposure.
Macquarie Data Centres and the Australian Sovereign AI Context
The Australian market for AI infrastructure has specific characteristics that amplify the observability requirement. In a January 2026 OCP Podcast episode, David Hirst, CEO of Macquarie Data Centres, discussed how AI workloads are shifting data center design from ‘real estate’ to ‘chip-out thinking’ and why Australia’s sovereign approach matters. Hirst described the Australian market as distinct, with compliance serving as a market advantage for operators who can demonstrate data residency and operational control. He noted that liquid cooling, megawatt-per-rack designs, and power challenges are reshaping how AI infrastructure gets built in dense Australian cities.
Packet Brokers and INT Telemetry: The Missing Layer for AI Fabric Visibility
For Australian AI platform teams, the observability pipeline for GPU backend fabrics typically requires three layers that traditional enterprise networks did not need:
-
Switch-level telemetry: INT-capable switches export per-hop latency, queue depth, and congestion data embedded in packet headers or via streaming telemetry. SONiC’s modular architecture supports these capabilities through containerized agents.
-
Packet broker aggregation: Network packet brokers sit out of band on the fabric, aggregating copies of RDMA traffic for analysis, filtering irrelevant flows, replicating to multiple monitoring tools, and performing deduplication. For GPU backend fabrics carrying 100G/400G/800G links, packet brokers must handle line-rate traffic without introducing jitter.
-
AI-aware analytics: Telemetry data from INT and IPTPath, combined with packet broker output, feeds into monitoring platforms that understand RDMA semantics — not just TCP flow analysis.
This three-layer stack is where open networking delivers a structural advantage for sovereign deployments. Packet broker and telemetry capabilities that are proprietary and licensed in incumbent networking stacks become deployable as open, controllable infrastructure when the NOS and hardware are disaggregated. For Australian enterprises evaluating AI networking options, the question is whether the observability stack keeps data local and under operational control, or whether it requires cloud-connected analytics hosted outside Australian jurisdiction.
xSONiC’s product families — data center AI switches for spine-leaf fabrics, network packet brokers for traffic aggregation and security tool delivery, and bare-metal switches for custom NOS deployments — map to each layer of this observability pipeline. The buyer narrative for Australian sovereign AI inference is not just about switching performance; it is about building an observability architecture that satisfies both the platform engineering team’s troubleshooting needs and the compliance team’s data residency requirements.
What Australian AI Platform Teams Should Evaluate Now
Based on the source evidence, Australian enterprises planning or operating private AI inference infrastructure should evaluate their GPU network observability posture against several criteria:
Fabric telemetry capability: Can the switching platform export INT, IPTPath, or streaming telemetry data at the granularity needed to diagnose RDMA congestion, PFC pause frame storms, and per-flow latency? Does the NOS support these capabilities natively, or are they licensed add-ons?
Data sovereignty of observability data: Does the telemetry pipeline — from switch ASIC to collector to dashboard — keep all data within Australian jurisdiction? If the NOS vendor requires cloud-connected analytics, where is that data processed and stored?
Multi-vendor optionality: Is the switching platform locked to a single vendor’s ASIC and NOS, or does it support SAI-based hardware abstraction that allows multi-vendor switching with consistent telemetry exports?
Packet broker integration: Is there a network packet broker layer that can aggregate, filter, replicate, and deduplicate RDMA traffic at line rate for out-of-band analysis? Can it scale to 400G/800G links as the inference fabric grows?
Compliance alignment: Can the platform team demonstrate to internal audit, APRA, or other regulators that network-layer telemetry is collected, retained, and accessible within the sovereign data center footprint?
GPU Observability Acceptance Matrix
| Observability layer | Evidence to capture | Acceptance gate | Rework trigger |
|---|---|---|---|
| Fabric counters | Queue depth, drops, ECN marks, PFC pause, CNP, optics DOM, and route changes | 24 hours telemetry record across 100G/400G or 800G links | GPU incidents cannot be tied to fabric state |
| Packet visibility | TAP/SPAN plan, packet broker filters, replication ratio, tool capacity, and loss counters | 30 minutes traffic replay with no sustained broker or tool drops | Security visibility is added after the AI fabric is live |
| Workload correlation | GPU job ID, node, NIC, switch port, queue, and timestamp alignment | Operators can correlate a slowdown to a fabric signal within 15 minutes | Platform and network teams use incompatible evidence |
| Sovereignty | Collector location, retention policy, access control, and audit log | Telemetry stays inside the approved Australian footprint | Cloud analytics path conflicts with data handling requirements |
| Operations | Alert thresholds, evidence bundle, rollback, support owner, and incident workflow | P1 simulation produces a complete evidence package within 2 hours | Monitoring detects symptoms but not ownership |
Engineering FAQ
What should be measured before sizing a packet broker? Measure source link speed, 95th-percentile utilisation, burst peaks, replication factor, filter complexity, tunnel handling needs, and tool-port capacity. Packet broker sizing fails when it is based on average traffic rather than copied and filtered traffic.
What proves that a visibility design is production ready? The design should prove aggregation, filtering, replication, load balancing, packet slicing or deduplication if required, and tool failover under realistic traffic. Security teams should also verify that drops are reported rather than hidden.
Where do Australian buyers most often under-scope visibility projects? The common gaps are east-west data centre traffic, encrypted or tunneled flows, AI cluster bursts, retention requirements, and tool oversubscription. A procurement brief should model those before asking vendors for a bill of materials.
Related xSONiC Resources
Sources Reviewed
- Ethernet Network Adapters - ConnectX NICs | NVIDIA
- NVIDIA BlueField Data Processing Unit
- NVIDIA Spectrum-X Ethernet Platform
- ACSC Essential Eight
- OAIC Notifiable Data Breaches
- APRA CPS 234 Information Security
- NETSCOUT Network Packet Definition
- Cloudflare Network Packet Definition
- SONiC Project Documentation
- Broadcom Ethernet Switching
- Marvell Switching
- NVIDIA Ethernet Switching
- Open Compute Networking
- SONiC GitHub
- SONiC Foundation
Product fit
Products referenced for evaluation
These products are referenced for evaluation context in the article. Confirm workload, port, optics, software, interoperability, and support requirements against the exact deployment before procurement.
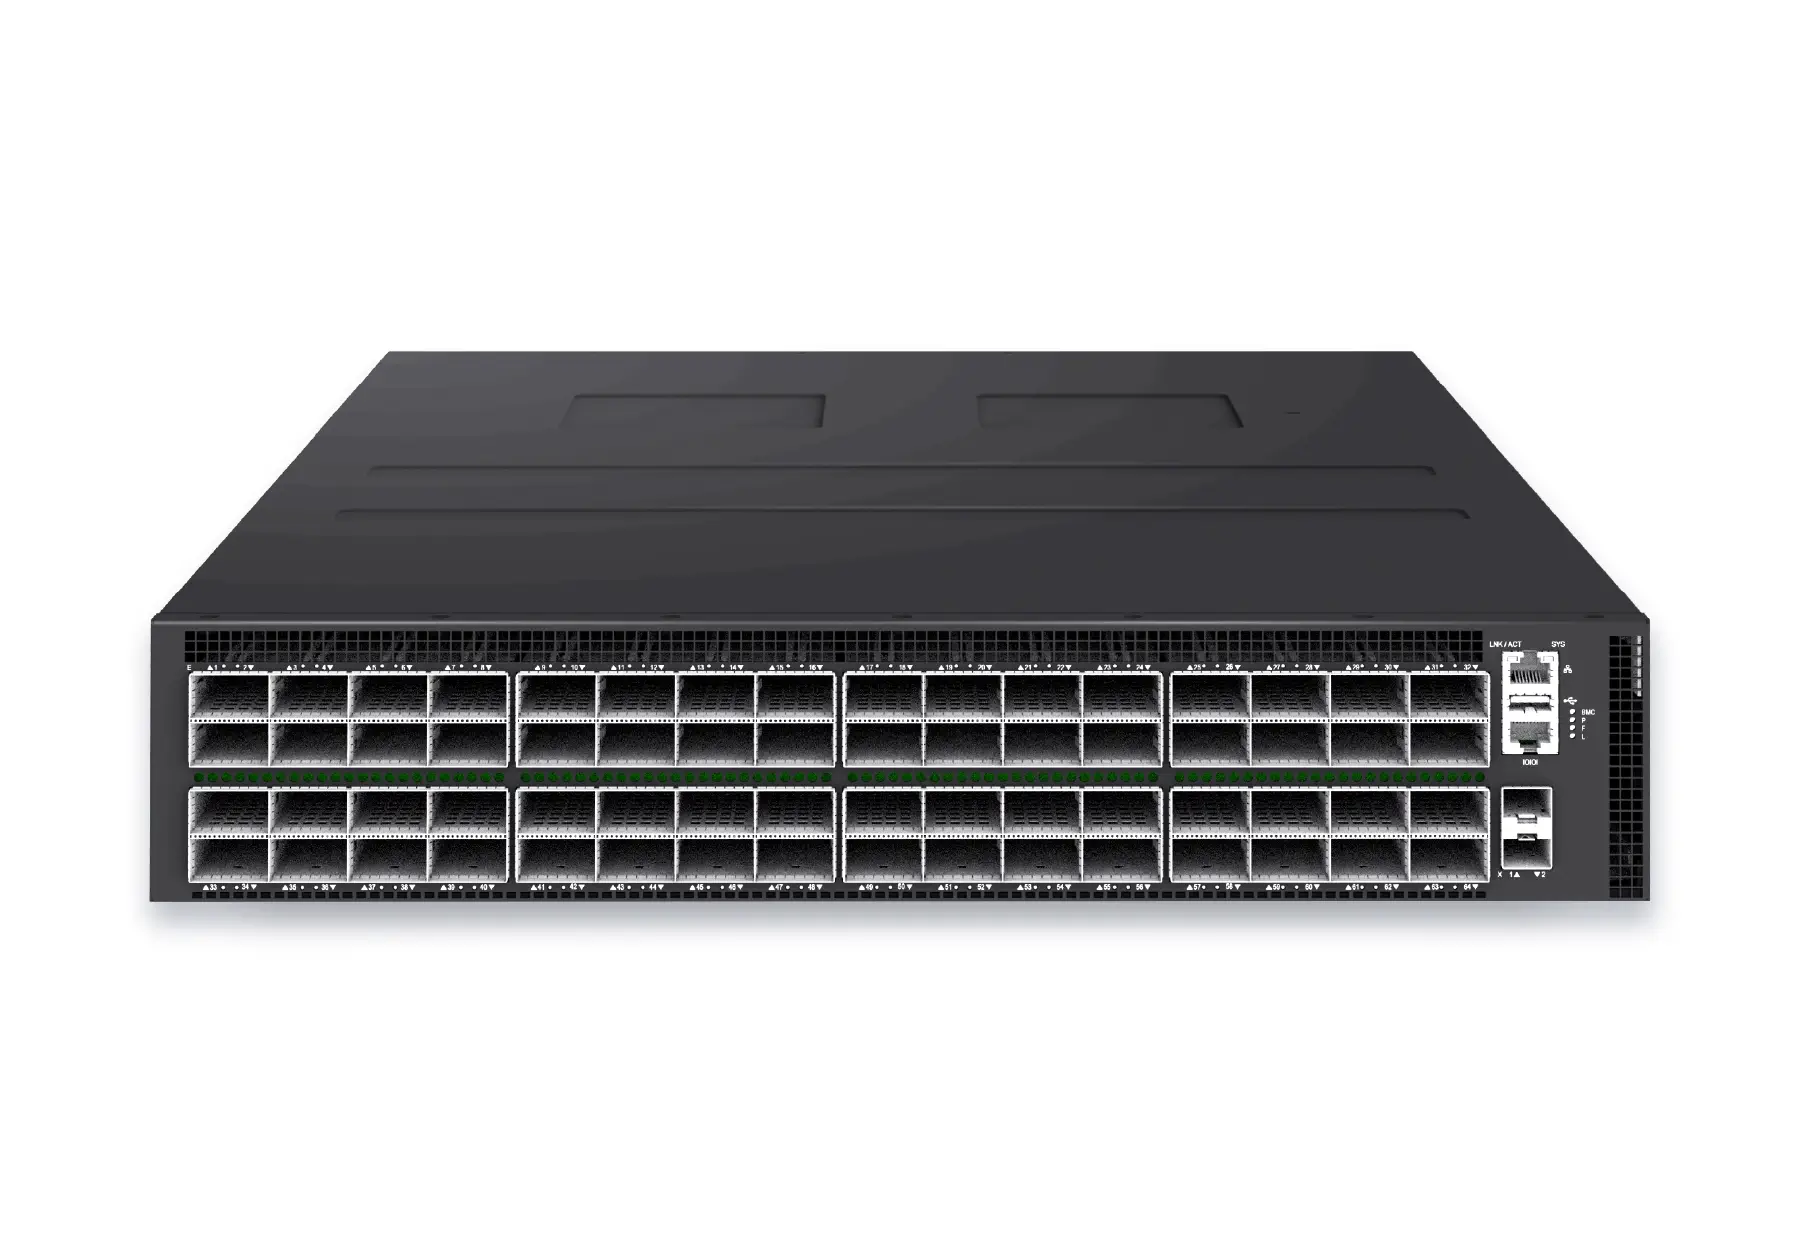 datacenter aiXS-DC-64X800-AI-G164-port 800G AI fabric switch for large-scale GPU clusters, HPC backbones, and ultra-high-throughput data center networks.View product
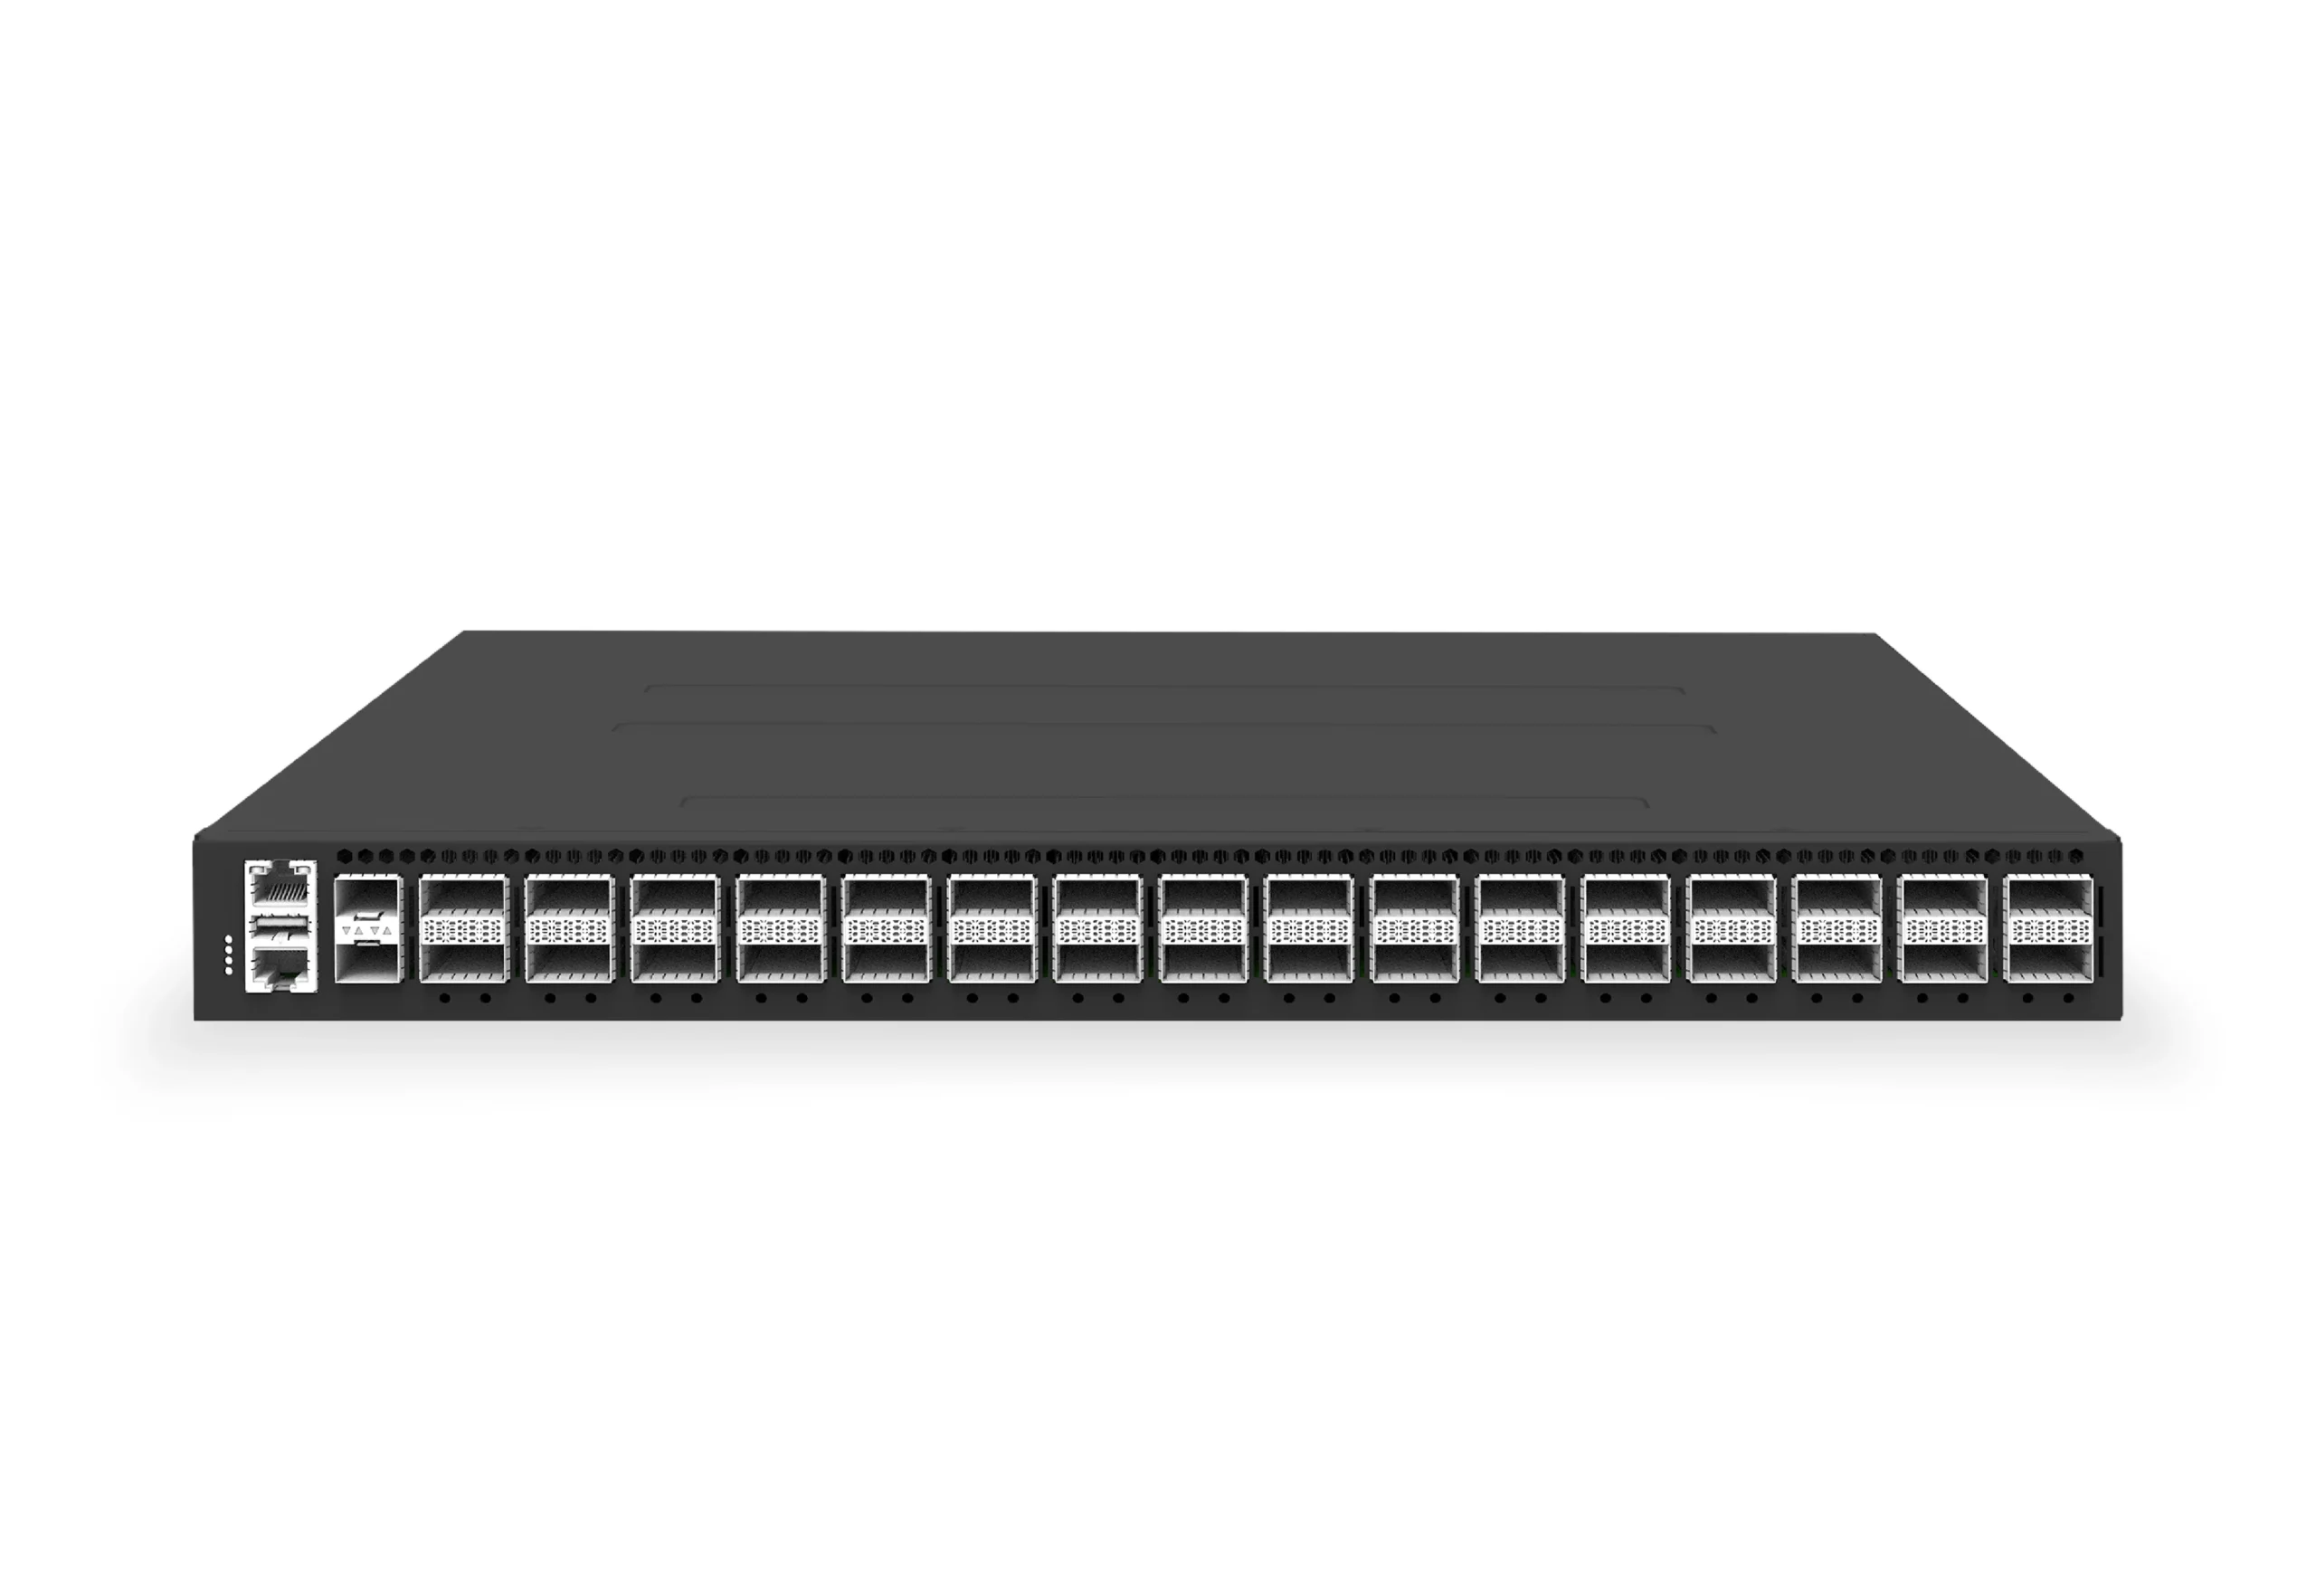 datacenter aiXS-DC-32X400-SP-G232-port 400G spine/core switch for high-capacity data center fabrics and AI-ready backbones.View product
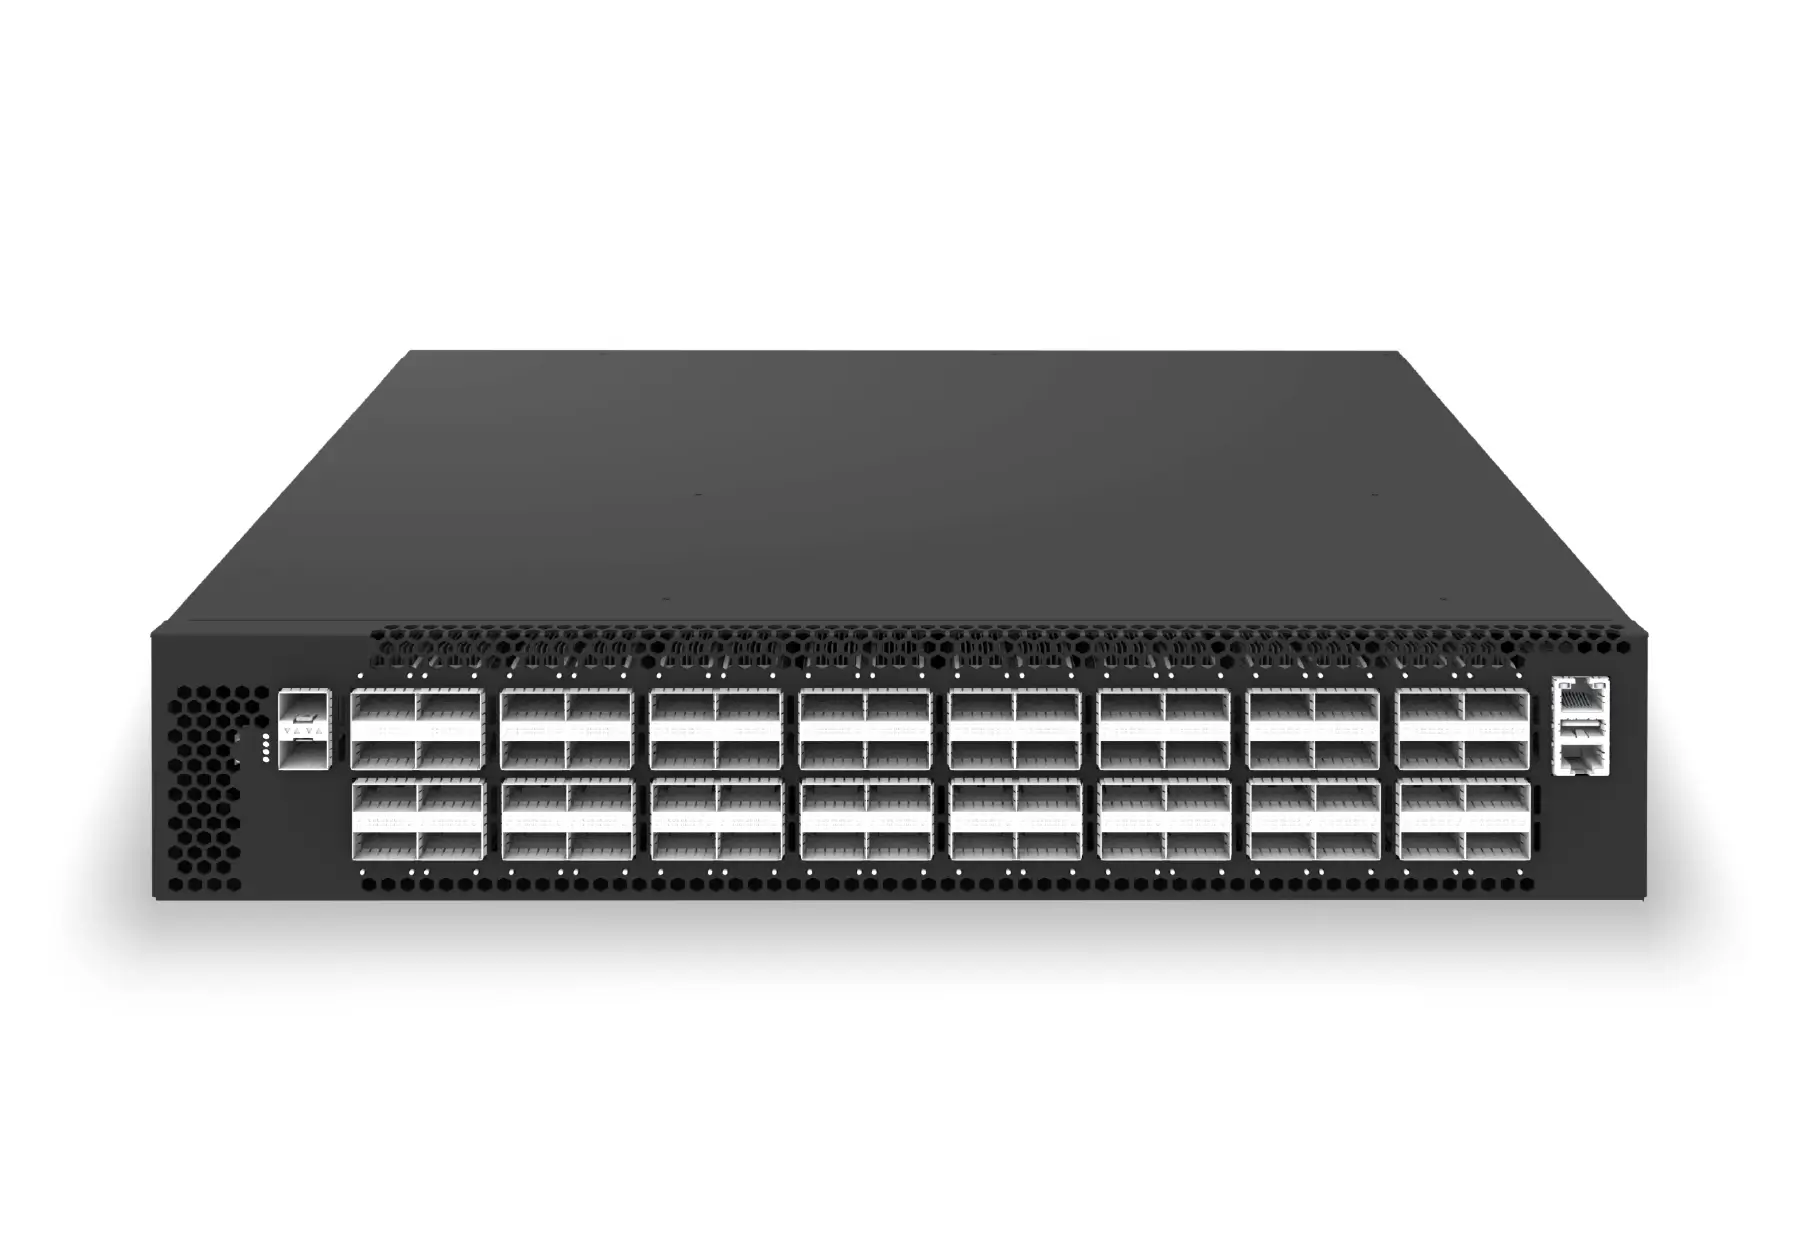 datacenter aiXS-DC-64X200-LS-G164-port 200G leaf/spine switch for high-bandwidth storage, compute, and scale-out data center fabrics.View product
Continue reading
Related articles
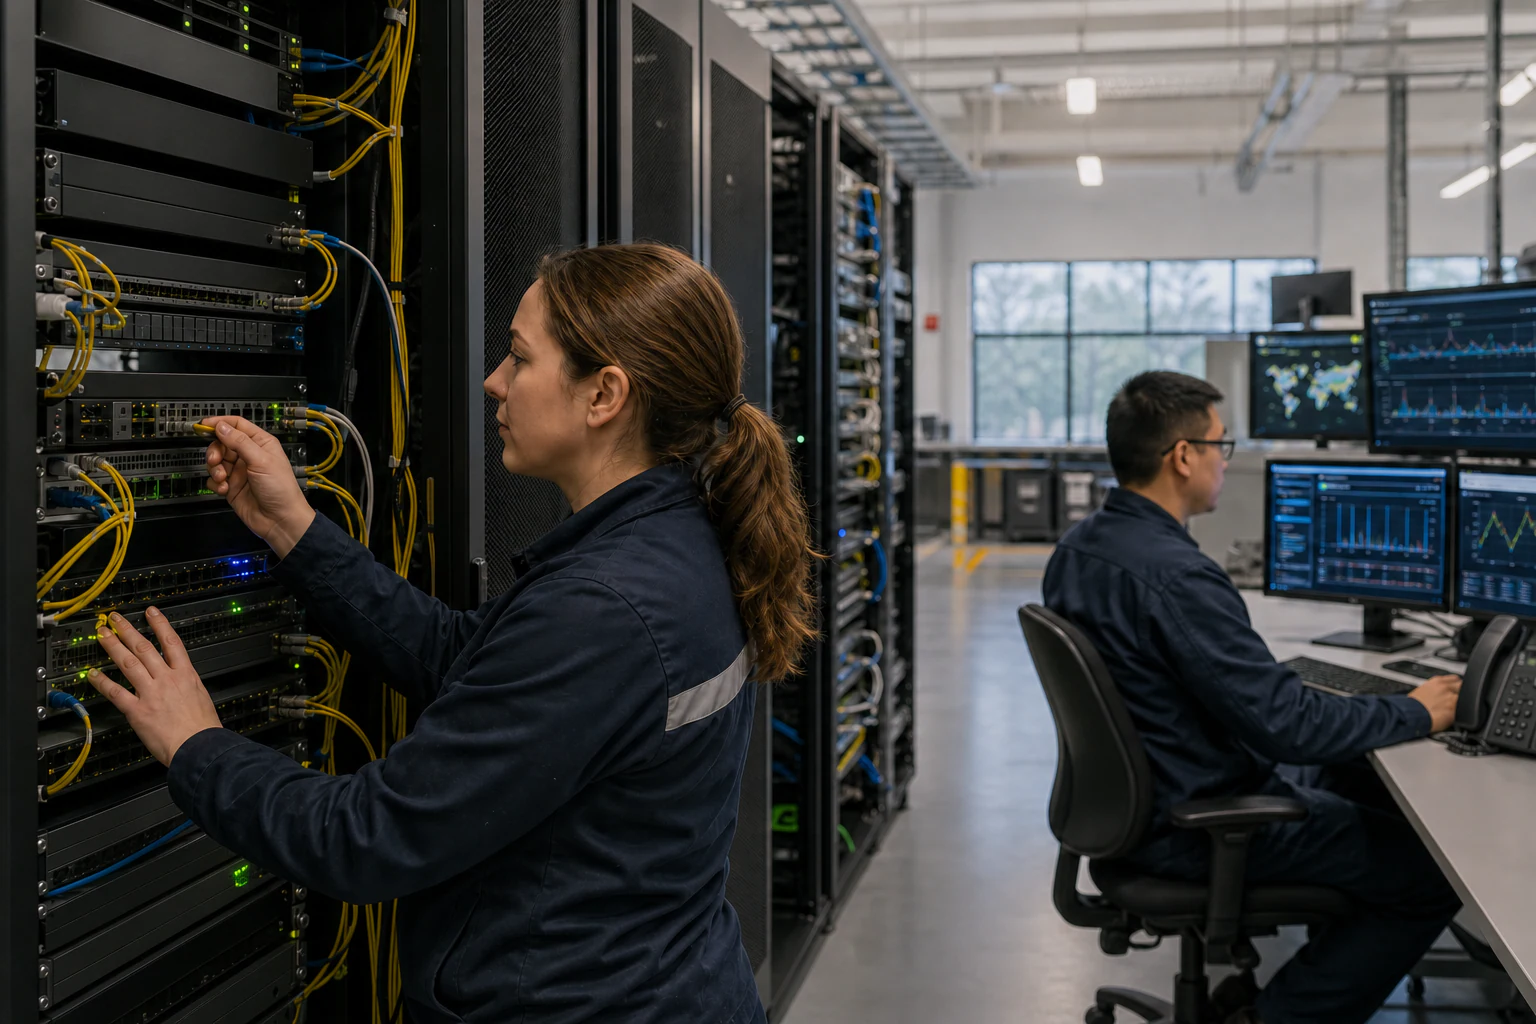 Technical ArticleHow Packet Brokers Filter, Replicate and Load-Balance TrafficEngineering guide for packet broker and visibility planning covering traffic capacity, filtering, tool delivery, resilience, and audit evidence.Read article
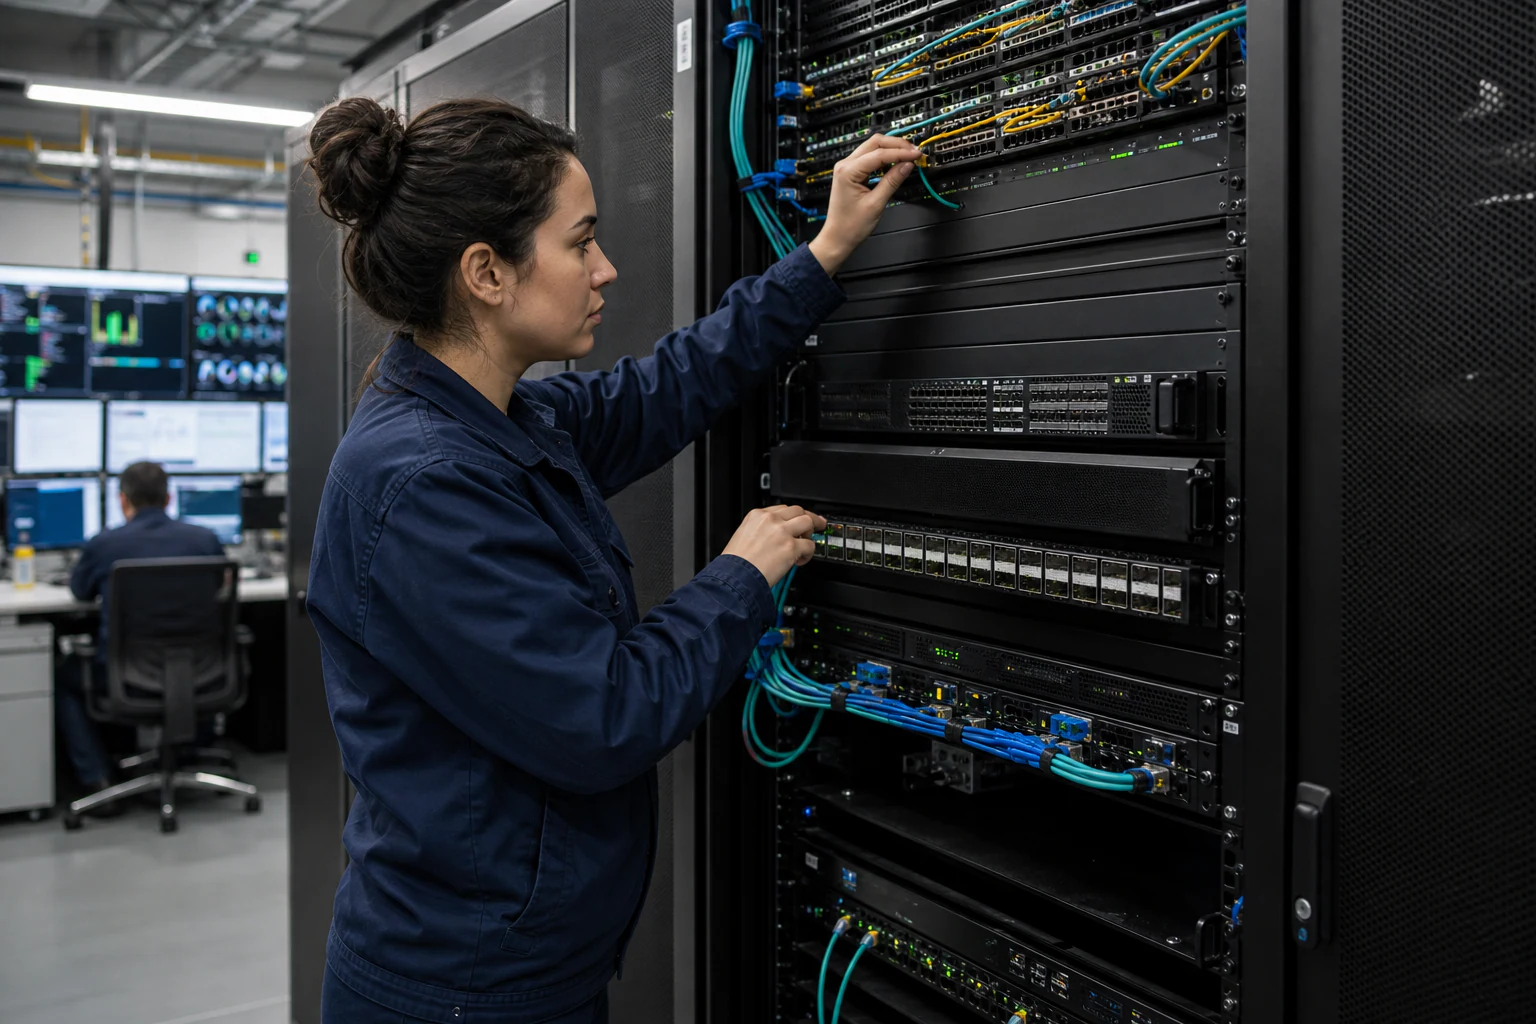 Technical ArticlePacket Broker Use Cases for Network Visibility and Observability: A Practical Guide for Australian EnterprisesEngineering use cases for packet brokers in observability, performance troubleshooting, AI fabrics, compliance capture, and multi-tool delivery.Read article
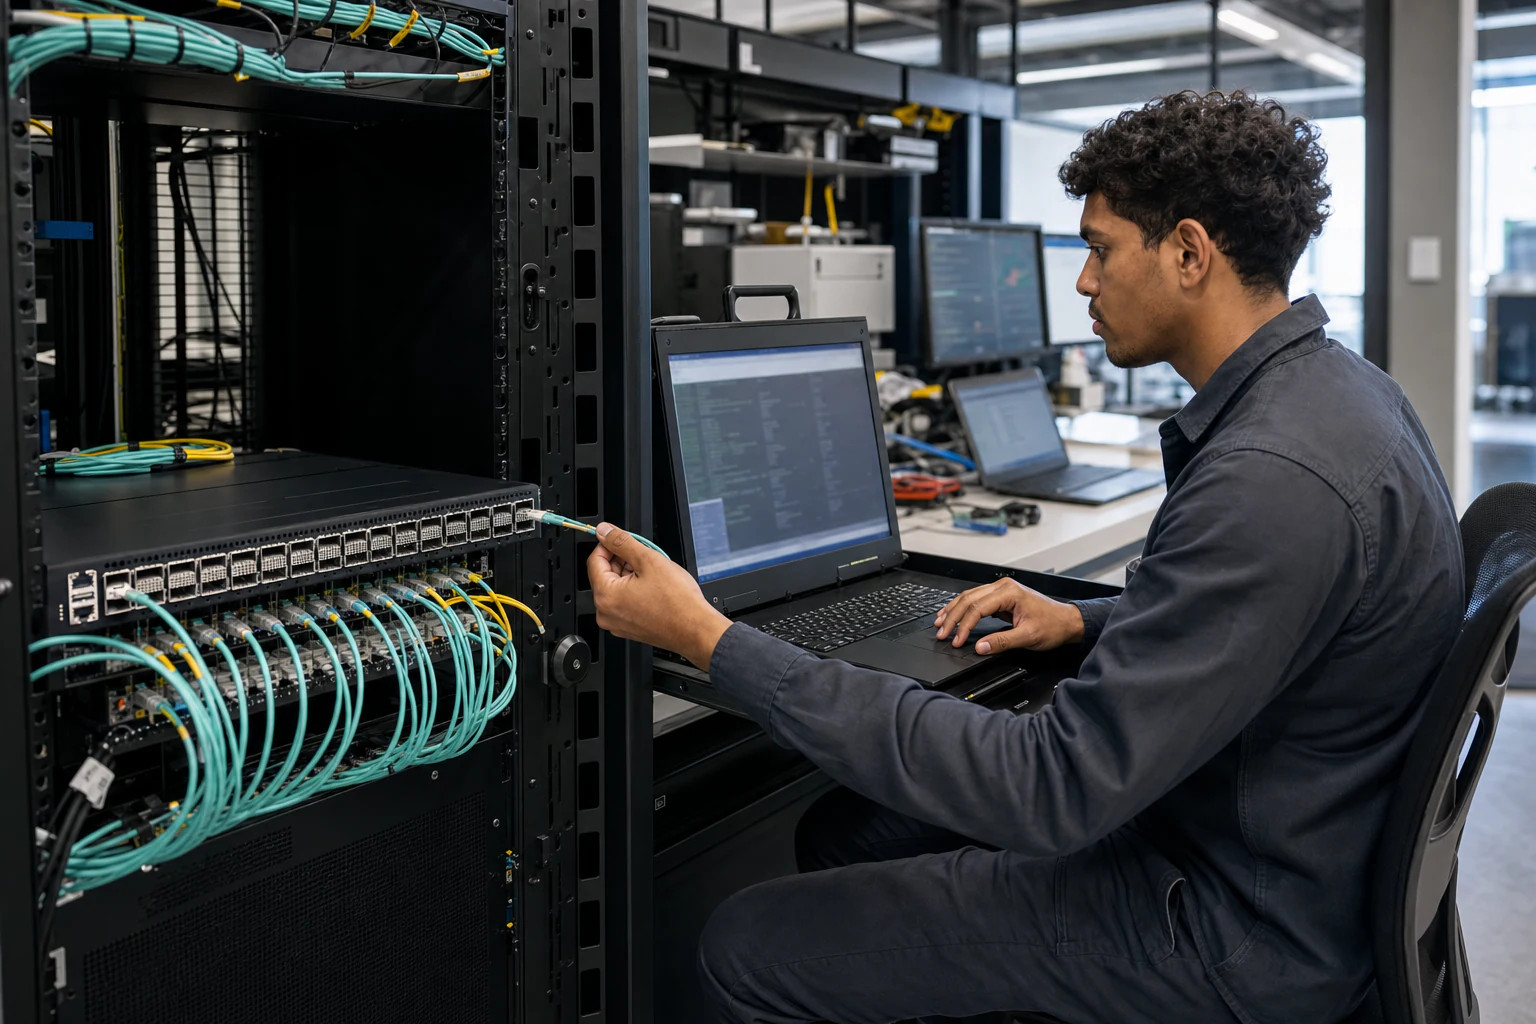 Technical ArticleWhy AI Data Centers Need In-Band Network Telemetry -- And Where Open SONiC FitsINT and path telemetry guide for AI fabric observability, covering SONiC support, RoCE congestion, telemetry pipelines, and buyer risk.Read article