
In brief
Compare SPAN, TAP aggregation, and packet broker approaches for traffic visibility, with an Australian enterprise checklist for monitoring, compliance, and security tool delivery.
Key takeaways
- Every security tool, every performance monitor, and every compliance audit depends on one foundation: whether your monitoring stack can actually see the traffic.
- Australian enterprise and data center teams face a convergence of pressures heading into 2026.
- This article compares the three dominant traffic capture approaches - SPAN port mirroring, standalone TAP aggregation, and dedicated packet broker appliances - then provides a deployment checklist tailored to Australian enterprise and data center environments.
Why Your Traffic Visibility Architecture Decision Matters More in 2026
Every security tool, every performance monitor, and every compliance audit depends on one foundation: whether your monitoring stack can actually see the traffic. If the answer is “we mirror a few switch ports,” you may have a blind spot problem hiding in plain sight.
Australian enterprise and data center teams face a convergence of pressures heading into 2026. The Security of Critical Infrastructure (SOCI) Act obligations continue to expand, the Notifiable Data Breaches scheme demands forensic-grade packet evidence, and the ACSC Essential Eight maturity model pushes organisations toward deeper inspection capabilities. At the same time, AI training clusters, RoCE v2 backend fabrics, and encrypted traffic volumes are straining legacy SPAN-based visibility architectures.
This article compares the three dominant traffic capture approaches - SPAN port mirroring, standalone TAP aggregation, and dedicated packet broker appliances - then provides a deployment checklist tailored to Australian enterprise and data center environments.
What Is a Network Packet?
Before comparing capture methods, it helps to ground the discussion in what is being captured. A network packet is the fundamental unit of data transmitted across a packet-switched network. Each packet consists of a header containing control information such as source and destination addresses, protocol identifiers, and error detection codes, plus a payload carrying the application data. In IPv4, the header includes fields for version, type of service, total length, time-to-live, and checksum. IPv6 streamlines some of these fields while expanding address space to 128 bits.
Packets are processed independently as they traverse network infrastructure, taking potentially different paths to the same destination. This is the core of packet switching, where bandwidth is shared dynamically rather than pre-allocated as in circuit switching. For visibility and monitoring teams, capturing these packets in transit - with full headers and payloads intact - is what enables performance diagnostics, security forensics, and compliance evidence gathering.
The Three Approaches: SPAN, TAP Aggregation, and Packet Broker
SPAN Port Mirroring
Switched Port Analyzer (SPAN), also called port mirroring, is a feature built into most managed switches. The switch copies traffic from one or more source ports or VLANs to a designated destination port where a monitoring tool is connected.
Strengths:
- Zero additional hardware cost if the switch already supports SPAN
- Simple to configure on a per-switch basis
- Adequate for low-throughput troubleshooting on small networks
Weaknesses:
- The switch CPU handles mirroring, which can cause packet drops under load
- Drops are silent; the monitoring tool receives no indication that traffic was missed
- Typically limited to a fraction of the switch backplane capacity
- Cannot reliably handle 10G, 25G, 40G, or higher-speed links at full utilisation
- Multiple SPAN sessions can compete for internal switch resources
- No filtering, deduplication, or load balancing capabilities
Network TAPs with Basic Aggregation
A Test Access Point (TAP) is a dedicated hardware device inserted inline on a network link. It passively copies traffic flowing through that link without consuming switch CPU resources. A passive optical TAP, for example, splits the fibre signal so a copy is delivered to the monitoring port with zero impact on production traffic.
TAP aggregation refers to combining outputs from multiple TAPs into a smaller number of monitoring tool ports, often using a basic aggregation appliance or switch.
Strengths:
- No packet drops on the TAP itself; traffic is copied at the physical layer
- Does not depend on switch CPU or backplane
- Captures traffic including Layer 1 and Layer 2 errors that SPAN may miss
- Passive TAPs fail open (traffic continues if the TAP loses power)
Weaknesses:
- Requires physical insertion, which means a maintenance window for each link
- Basic aggregation devices may lack advanced filtering and deduplication
- Scaling to dozens or hundreds of links creates cabling and port-count challenges
- No native support for application-aware filtering, timestamping, or header modification
Dedicated Packet Broker Appliance
A packet broker is a purpose-built appliance or platform that receives traffic from multiple TAPs and SPAN ports, then applies filtering, aggregation, deduplication, load balancing, header stripping, and forwarding logic before delivering processed traffic to monitoring and security tools. According to NETSCOUT, packet brokers gather traffic from numerous network links, filter and redirect individual packets to the optimal monitoring tool, improving the effectiveness of both network monitoring and security tools.
Strengths:
- Centralises visibility architecture across many links and sites
- Advanced filtering ensures each tool receives only the traffic it needs
- Deduplication prevents tools from processing redundant copies of the same packet
- Load balancing distributes traffic across tool clusters to prevent oversubscription
- Supports header stripping (VXLAN, GRE, MPLS) for overlay and fabric environments
- Can apply timestamping, packet slicing, and masking for compliance and forensic use
- Programmable and extensible for evolving traffic patterns
Weaknesses:
- Higher upfront cost than SPAN-only deployments
- Requires design work to align filter rules with tool requirements
- Adds a device that must be managed, monitored, and updated
Comparison Table
| Dimension | SPAN | TAP + Basic Aggregation | Packet Broker |
|---|---|---|---|
| Packet drop risk under load | High | Low on TAP, varies on aggregator | Low with proper sizing |
| Layer 1/2 error visibility | No | Yes | Yes |
| Filtering and forwarding rules | No | Limited | Advanced |
| Deduplication | No | Limited | Yes |
| Load balancing across tools | No | Limited | Yes |
| VXLAN/GRE/MPLS header stripping | No | No | Yes |
| Scaling to 40G/100G/400G links | Poor | Moderate | Purpose-built |
| Impact on production switch | Yes (CPU) | No | No |
| Upfront hardware cost | Low (existing switch) | Moderate | Higher |
| Total cost of blind spots | High (unquantified) | Moderate | Low (managed) |
Australian Enterprise Deployment Checklist
Use the following checklist when evaluating or upgrading your traffic visibility architecture in 2026.
1. Inventory Your Current Capture Points
- Map every SPAN session, TAP, and monitoring port currently deployed
- Document the link speed and average utilisation of each monitored segment
- Identify links where SPAN drops have been observed or suspected
- Note which switches support ERSPAN versus local SPAN only
2. Assess Compliance and Forensic Requirements
- Confirm SOCI Act obligations for your sector and whether packet-level evidence is required
- Map Notifiable Data Breaches scheme requirements to your incident response evidence chain
- Review ACSC Essential Eight maturity targets and whether deep packet inspection is needed for levels two and three
3. Evaluate Coverage Gaps
- Identify east-west traffic segments (within data centre, between racks) that are currently unmonitored
- Map overlay fabric traffic (VXLAN, EVPN) that SPAN copies with encapsulation headers intact
- Assess AI/ML cluster backend links (typically 25G, 100G, 400G) for RoCE v2 traffic that requires lossless capture
- Identify encrypted links where TLS inspection or metadata extraction depends on complete packet capture
4. Size the Architecture
- Calculate total ingress bandwidth across all monitored links
- Determine the aggregate output bandwidth required to serve all tools
- Account for oversubscription ratios; most tools do not need 1:1 input-to-output
- Plan for 2x growth in monitored bandwidth over 24 months to account for 400G adoption and AI fabric expansion
5. Design Filter and Forward Logic
- Define per-tool filter policies: which VLANs, protocols, or IP ranges each tool requires
- Map deduplication needs, especially for links where both directions are TAPed independently
- Plan header-stripping rules for VXLAN, GRE, MPLS, and GTP overlays
- Consider packet slicing to reduce tool load when only headers are needed for analysis
- Define timestamping requirements for forensic and compliance evidence integrity
6. Plan Physical Insertion
- Schedule maintenance windows for TAP insertion on critical links
- Evaluate passive optical TAPs for fibre links and copper TAPs for legacy segments
- Confirm fail-open behaviour requirements for each insertion point
- Plan cabling from TAP outputs to the packet broker appliance locations
7. Integrate with Existing Tools
- Map tool ingress ports (IDS, SIEM packet capture, NPM, APM, forensics) to packet broker output ports
- Confirm tool ingress speed compatibility (some tools accept 10G only; broker may output 25G or 100G)
- Test tool behaviour with deduplicated and filtered traffic versus raw SPAN output
- Validate that compliance-grade timestamps survive the broker processing pipeline
8. Operational Readiness
- Define monitoring for the packet broker itself (health, port status, buffer utilisation, filter hit rates)
- Establish change control procedures for filter rule modifications
- Document failover and redundancy paths for the packet broker (HA pair, bypass module)
- Train NetOps and SecOps teams on packet broker management interfaces
When SPAN Is Still Acceptable
SPAN is not always wrong. For ad hoc troubleshooting on a single switch, for lab environments, or for very small branch sites with low utilisation and no compliance mandate, SPAN may be sufficient. The risk begins when SPAN becomes the permanent visibility strategy for production data centre links, campus aggregation points, or compliance-sensitive segments. In those environments, silent packet drops, lack of deduplication, and inability to handle overlay headers create operational and legal risk that grows with traffic volume.
The Migration Path: From SPAN to Packet Broker
For Australian enterprises currently relying on SPAN as the primary capture method, the migration to a packet broker architecture does not need to happen all at once. A phased approach works well:
- Phase 1: Deploy TAPs on the highest-risk links (data centre spine, internet edge, compliance-sensitive VLANs)
- Phase 2: Install the packet broker appliance and connect Phase 1 TAP outputs
- Phase 3: Define filter and forwarding rules for existing tools
- Phase 4: Extend TAP coverage to campus aggregation, branch WAN links, and AI fabric backends
- Phase 5: Retire SPAN sessions that are now covered by TAP-to-broker paths
This phased migration allows each phase to be validated independently and limits the operational risk of any single change window.
Connecting Visibility to AI Fabric and Telemetry
Modern data centre fabrics running EVPN-VXLAN overlays, RoCE v2 for GPU backend communication, and INT or IPTPath telemetry generate traffic patterns that legacy SPAN architectures handle poorly. Encapsulated overlay frames arrive at monitoring tools with VXLAN or GRE headers that must be stripped before analysis. RoCE v2 flows require lossless capture to detect congestion notification issues. Telemetry data from INT-capable switches must be correlated with packet-level captures for root cause analysis.
A packet broker positioned between the fabric and the monitoring tool stack becomes the natural control point for these tasks. It strips overlay headers, deduplicates mirrored copies, and distributes traffic by protocol or flow to the appropriate tool - whether that is a security appliance, a network performance monitor, or an AI fabric observability platform.
Summary
The choice between SPAN, TAP aggregation, and a dedicated packet broker is not purely a technical one. It is a risk and compliance decision for Australian organisations operating under SOCI Act obligations, Essential Eight targets, and Notifiable Data Breaches scheme requirements. SPAN provides a low-cost starting point but introduces silent packet drops, lack of filtering, and scalability limits. TAPs solve the capture reliability problem. A packet broker completes the architecture by adding filtering, deduplication, load balancing, header manipulation, and centralised management - the capabilities that turn raw packet capture into a usable visibility platform.
For Australian enterprise and data center teams planning 2026 network upgrades, the packet broker investment pays for itself in tool efficiency, compliance readiness, and operational confidence.
Contact xSONiC to discuss packet broker sizing for your data centre or campus environment.
Engineering FAQ
Is SPAN still acceptable for production monitoring? SPAN is acceptable for short troubleshooting windows and low-throughput lab cases. It should not be the only visibility method for high-speed data center links, regulated systems, or permanent security monitoring.
When should a TAP be used instead of SPAN? Use a TAP when packet fidelity matters and the capture point must not depend on switch CPU, mirror-session limits, or production forwarding resources.
What does a packet broker add beyond TAP aggregation? A broker adds policy: filtering, deduplication, load balancing, header manipulation, tunnel handling, packet slicing, timestamping, and multi-tool delivery.
What should be tested in a packet broker PoC? Test line-rate capture, peak oversubscription behaviour, filter scale, duplicate removal, VXLAN or GRE handling, tool load balancing, failover, and management API behaviour.
Related xSONiC Resources
Sources Reviewed
- Ethernet Network Adapters - ConnectX NICs | NVIDIA
- NVIDIA BlueField Data Processing Unit
- NVIDIA Spectrum-X Ethernet Platform
- ACSC Essential Eight
- OAIC Notifiable Data Breaches
- APRA CPS 234 Information Security
- NETSCOUT Network Packet Definition
- Cloudflare Network Packet Definition
- SONiC Project Documentation
- Broadcom Ethernet Switching
- Marvell Switching
- NVIDIA Ethernet Switching
- Open Compute Networking
- SONiC GitHub
- SONiC Foundation
Product fit
Products referenced for evaluation
These products are referenced for evaluation context in the article. Confirm workload, port, optics, software, interoperability, and support requirements against the exact deployment before procurement.
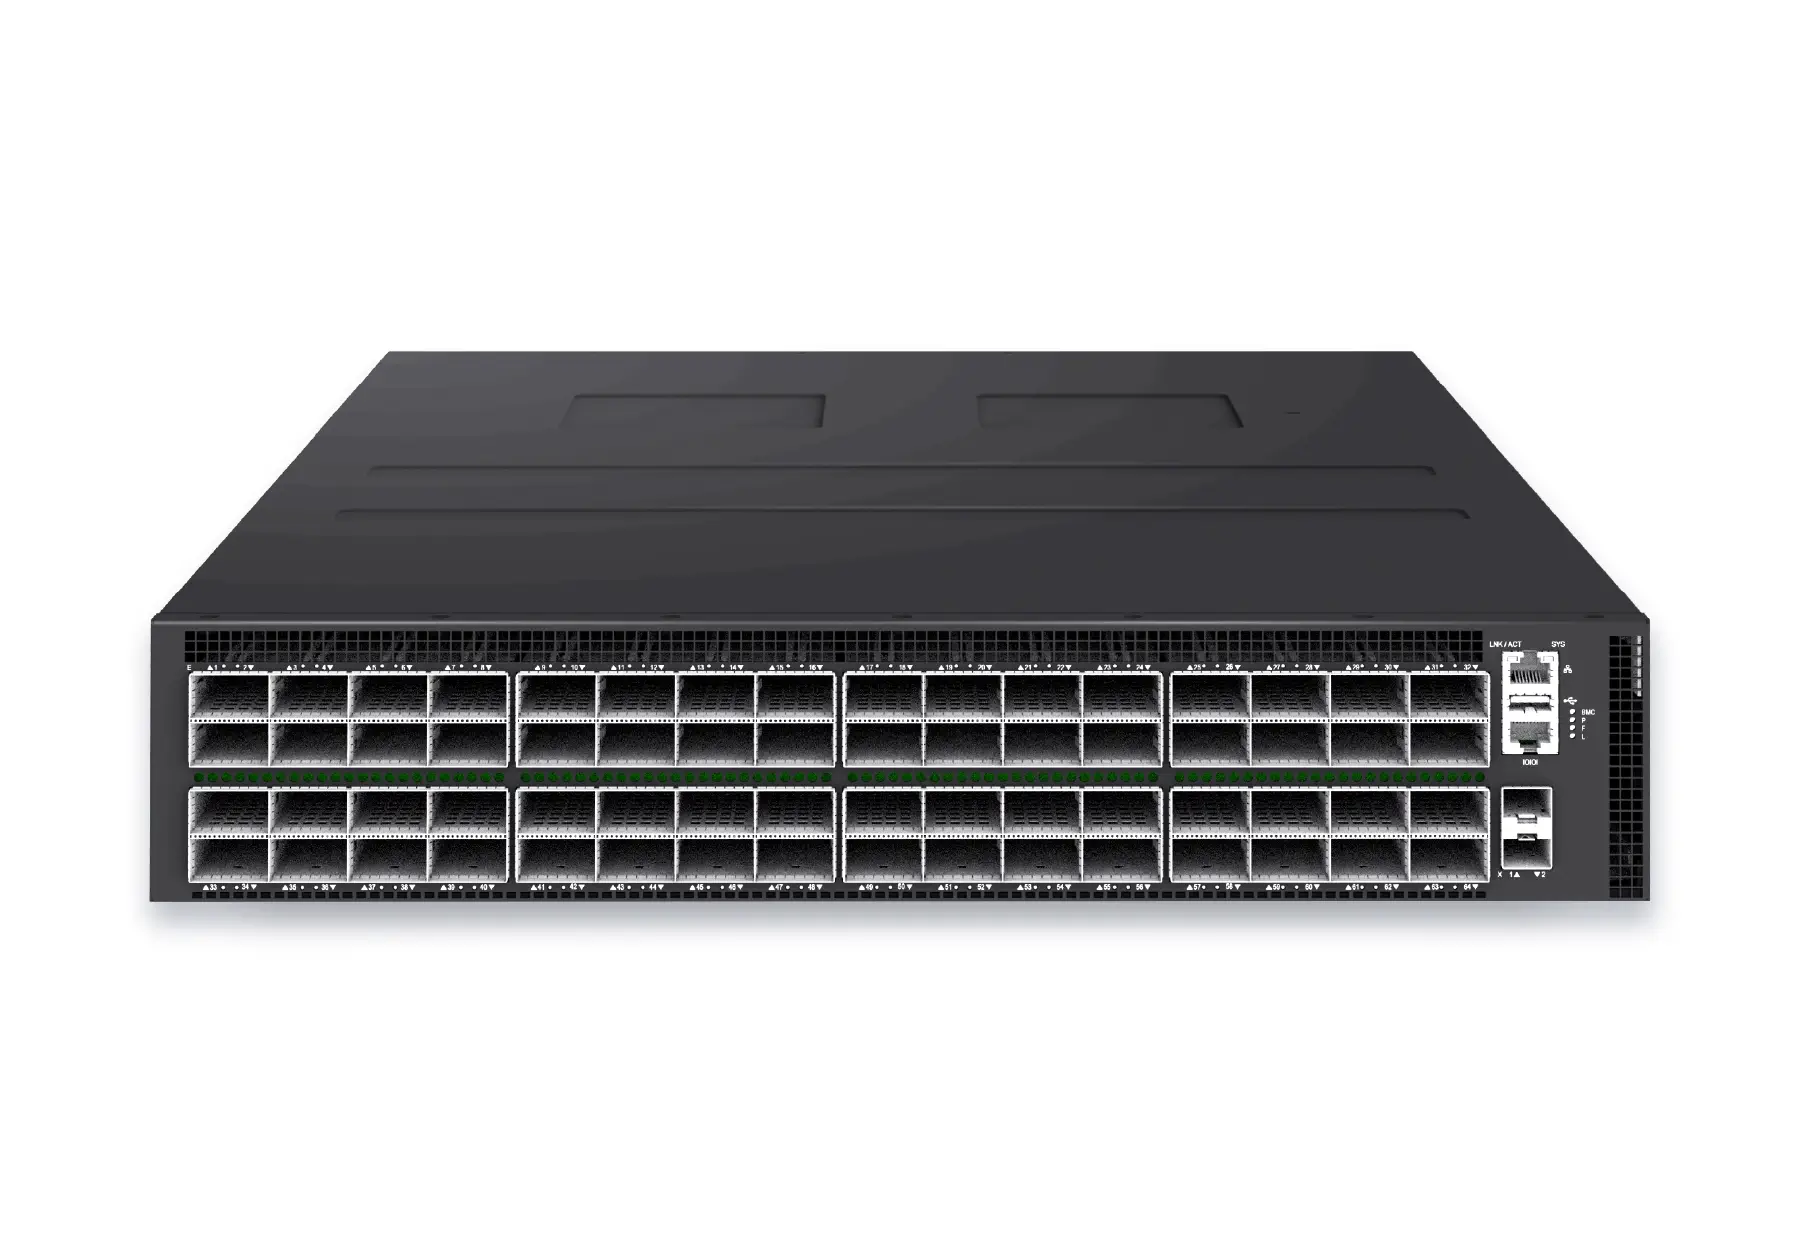 datacenter aiXS-DC-64X800-AI-G164-port 800G AI fabric switch for large-scale GPU clusters, HPC backbones, and ultra-high-throughput data center networks.View product
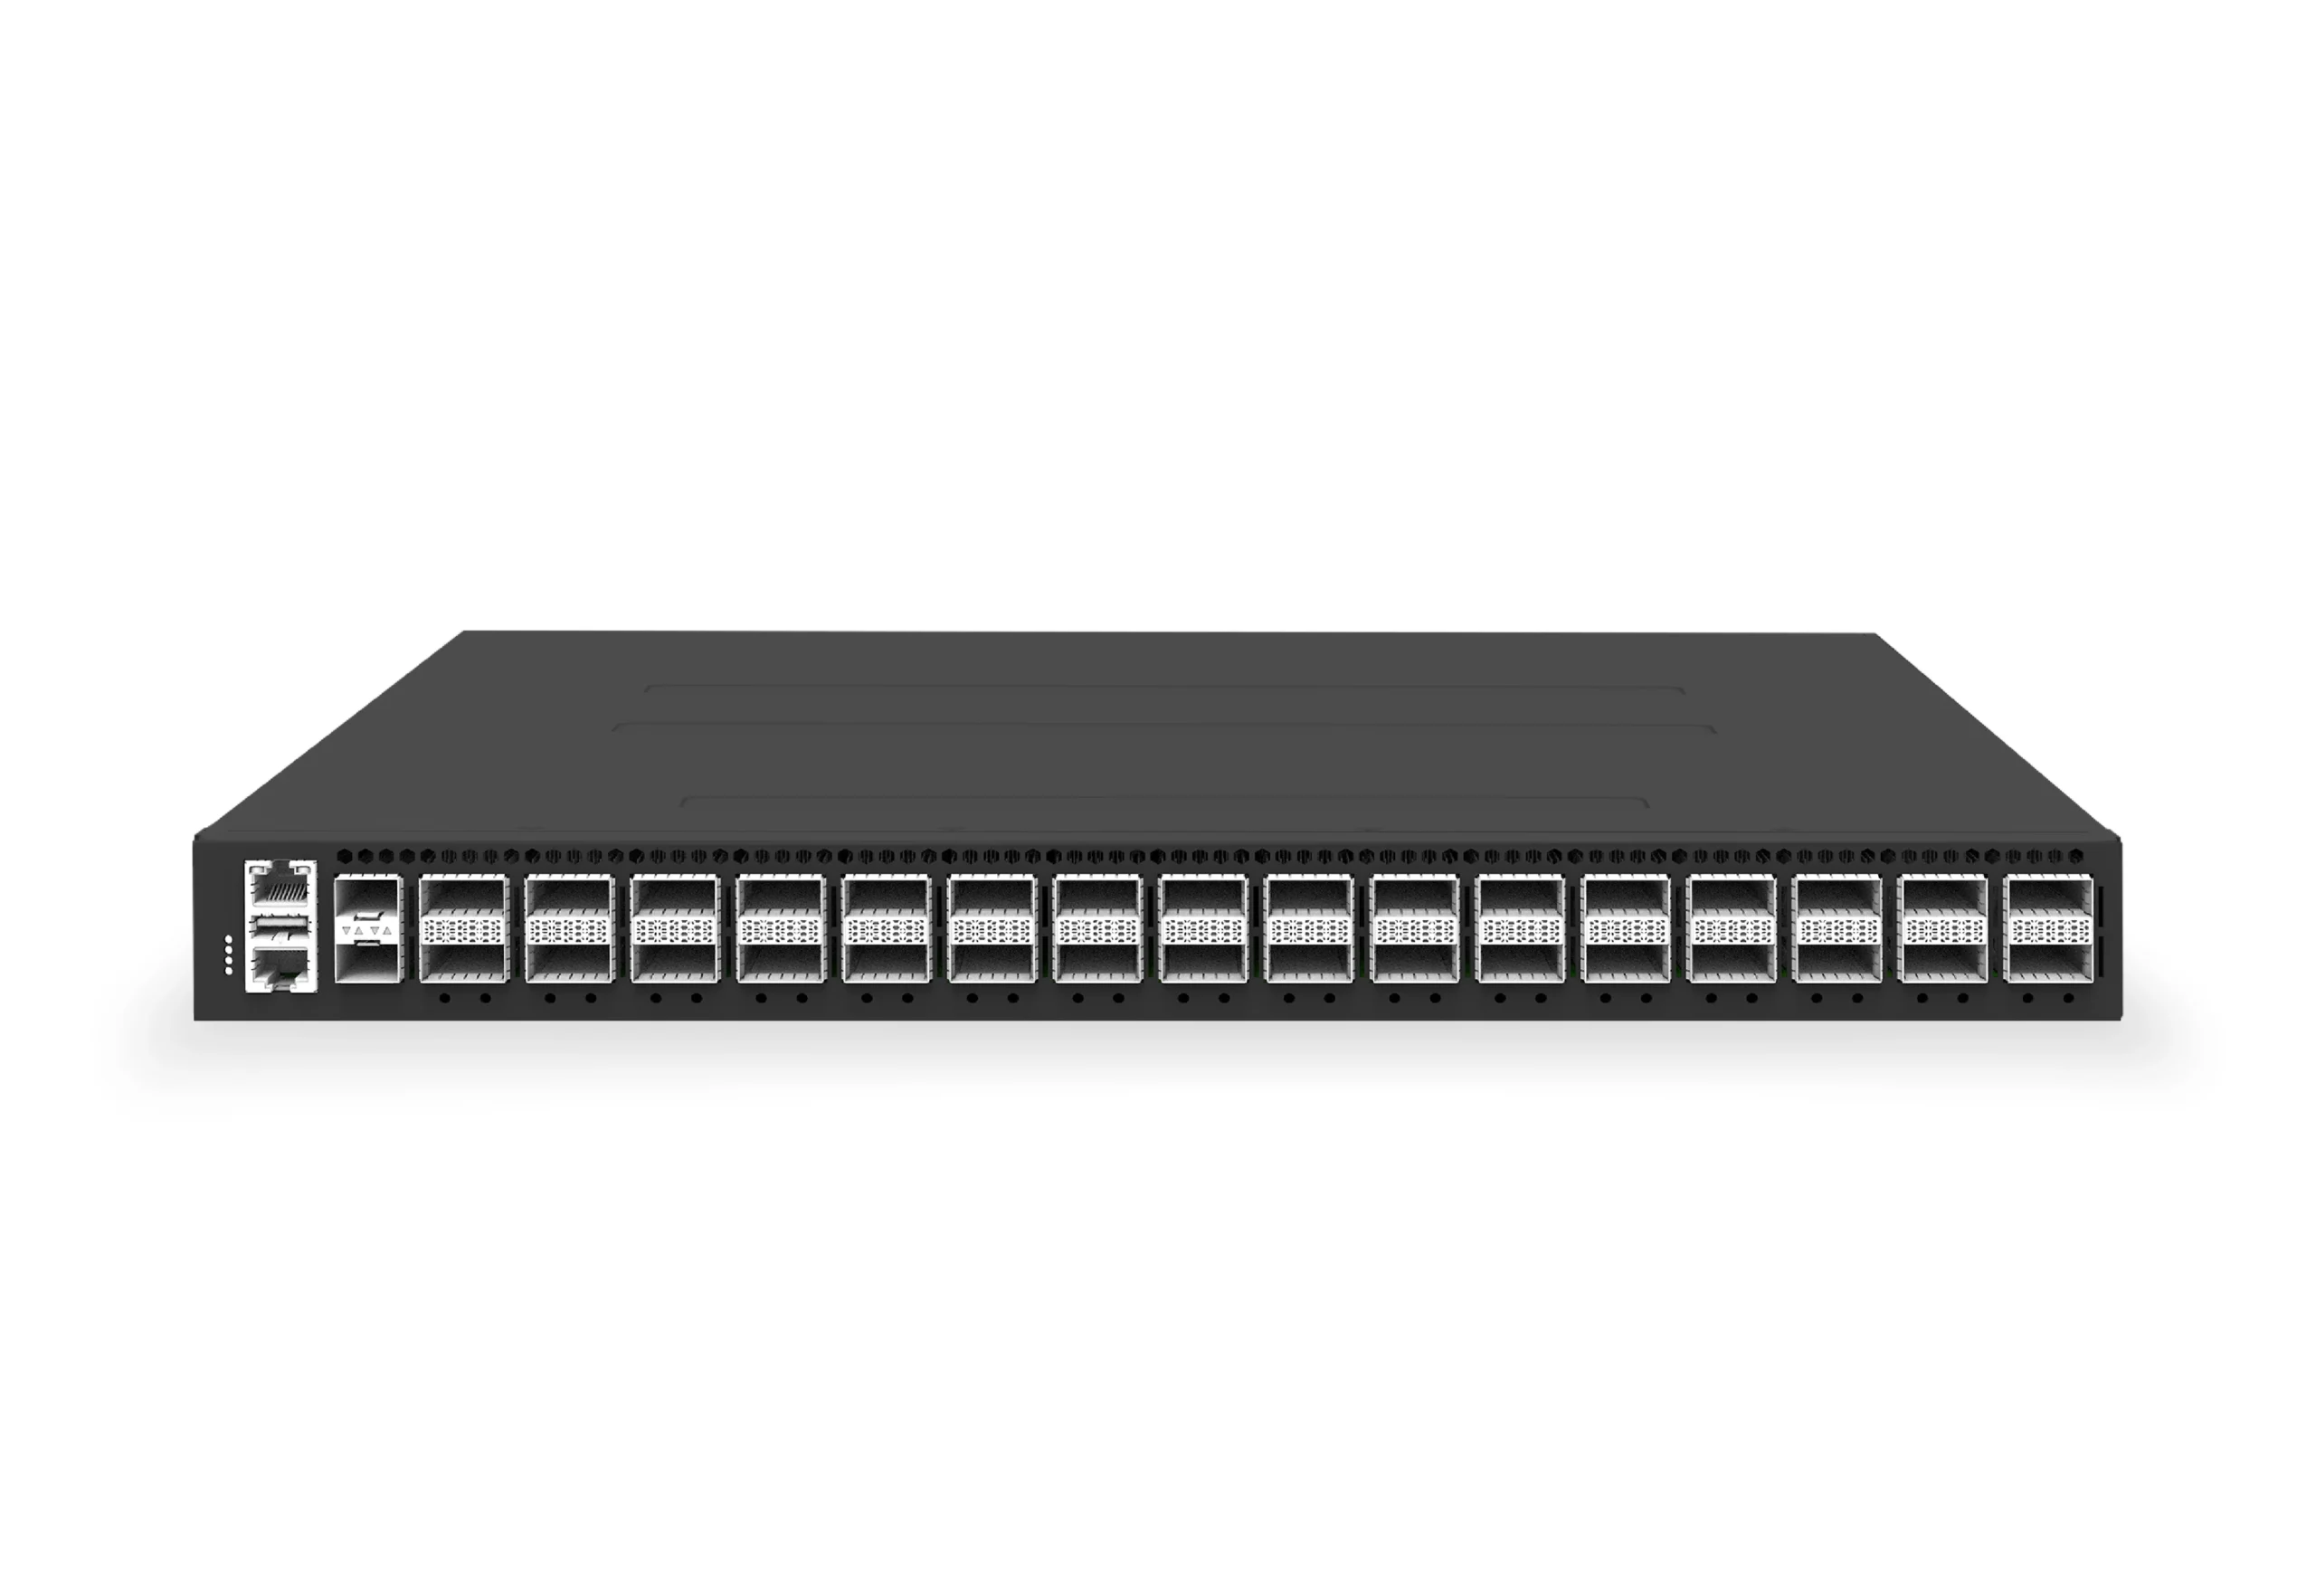 datacenter aiXS-DC-32X400-SP-G232-port 400G spine/core switch for high-capacity data center fabrics and AI-ready backbones.View product
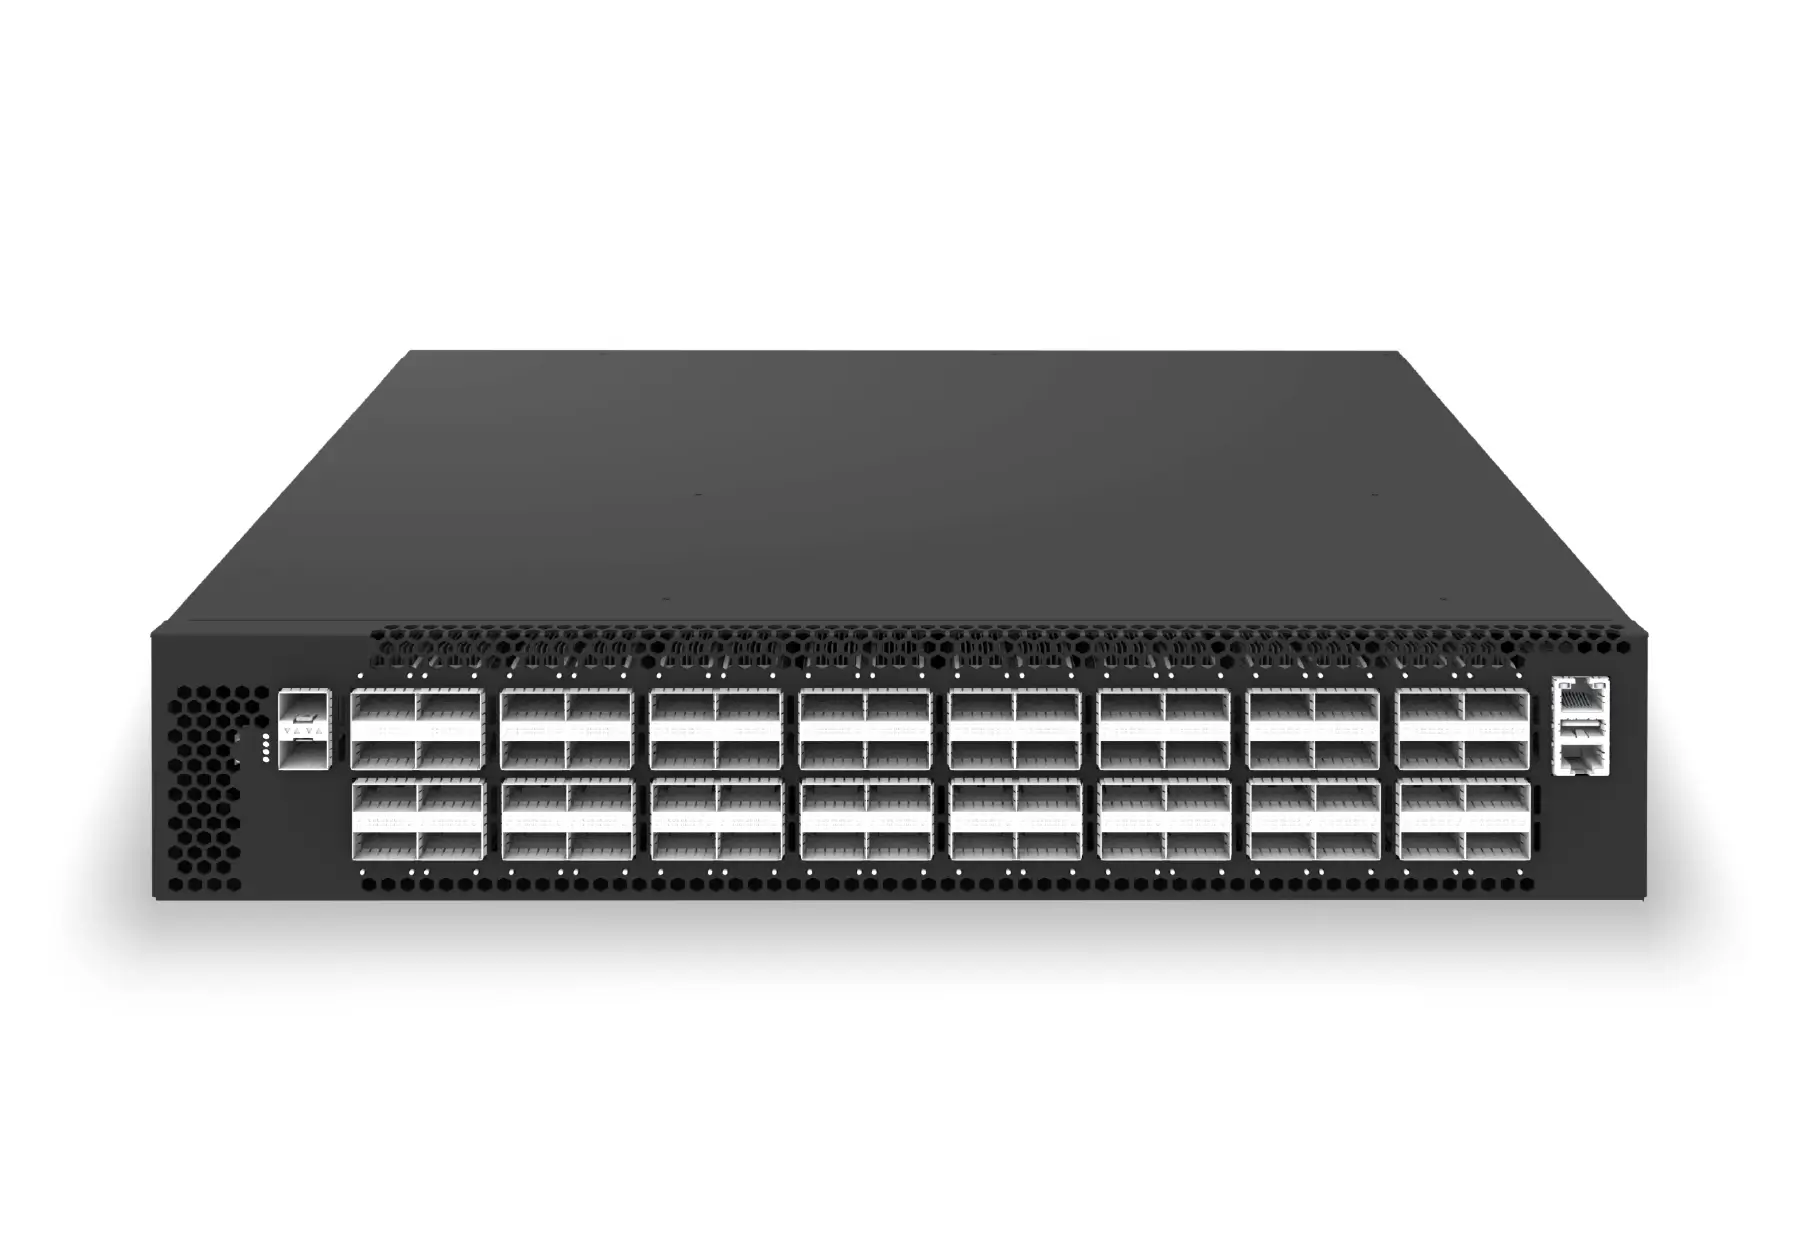 datacenter aiXS-DC-64X200-LS-G164-port 200G leaf/spine switch for high-bandwidth storage, compute, and scale-out data center fabrics.View product
Continue reading
Related articles
 Technical ArticleNetwork Packet Broker Use Cases: Traffic Visibility, Filtering, and Tool DeliveryEngineering use cases for network packet brokers in data centre, campus, AI fabric, and security operations environments, with validation criteria for each design.Read article
 Technical ArticleINT and Path Telemetry RFP Guide for Australian Data CentresEngineering guidance on RFP Question Set for INT and Path Telemetry for Australian network operators, covering gNMI, NETCONF/YANG, OpenConfig, telemetry pipelines, and.Read article
 Technical ArticlePacket Broker Security Hardening Checklist for Australian MSPs and IntegratorsPacket-broker hardening checklist for Australian MSPs and integrators, covering segmentation, access control, logging, configuration audits, and secure tool delivery.Read article